Thursday, July 28, 2016

Learning with DVRF - Step 4

Step 4: Get buildroot installed and configured on the system


This step will focus on getting buildroot installed and configured. This is blog post 4 of x on learning with the DVRF project blog post series.

  1. We need to add in cross-compiling support to the system so we can continue with the rest of the work. For this and as the original author stated, buildroot will be used. The original article references the “2015.11” version, but at the time of this writing “2016.05” is the latest stable copy. We will use the latest version of buildroot for this article.
  2. In Terminal, type in:
    cd
  3. The previous command should put us back into our home directory, let’s create a folder for buildroot. In Terminal, type in:
    mkdir buildroot (press Enter)

    cd buildroot (press Enter)
  4. In Terminal, type:
    tar zxf buildroot-2016.05.tar.gz
  5. The above command will extract the files from the compressed archive. Now let’s go into the directory created from the above step. In Terminal, type in:
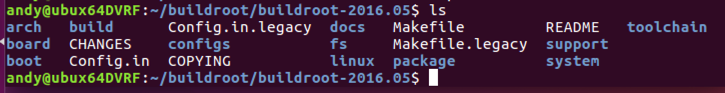
    cd buildroot-2016.05


  6. We can see the contents from buildroot in this directory if we type in “ls” into the terminal

  7. The next step is to go through the process to get buildroot functional onto our system. To accomplish this, type in “make menuconfig” in terminal to launch the buildroot configuration utility.
    make menuconfig
  8. When I tried, I got the following error about ncurses not being available

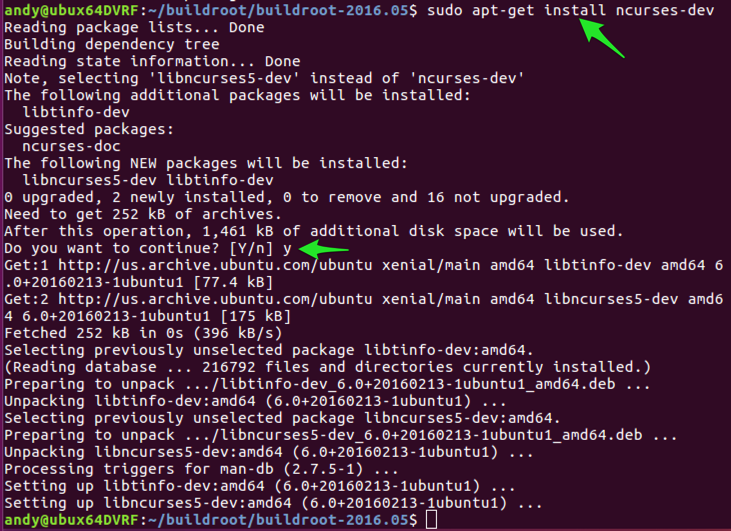
  9. Let’s try to install ncurses-dev and try again. In Terminal, type in:
    sudo apt-get install ncurses-dev (press enter)

    y (press enter)


  10. With ncurses installed, we should be able to proceed with the make menuconfig command as we previously tried. In Terminal, type in:
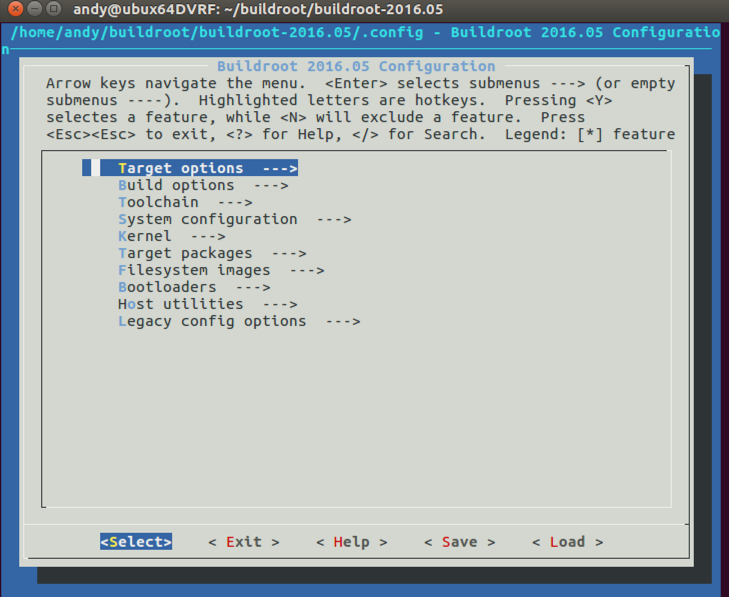
    make menuconfig
  11. Now we see a menu system for buildroot!

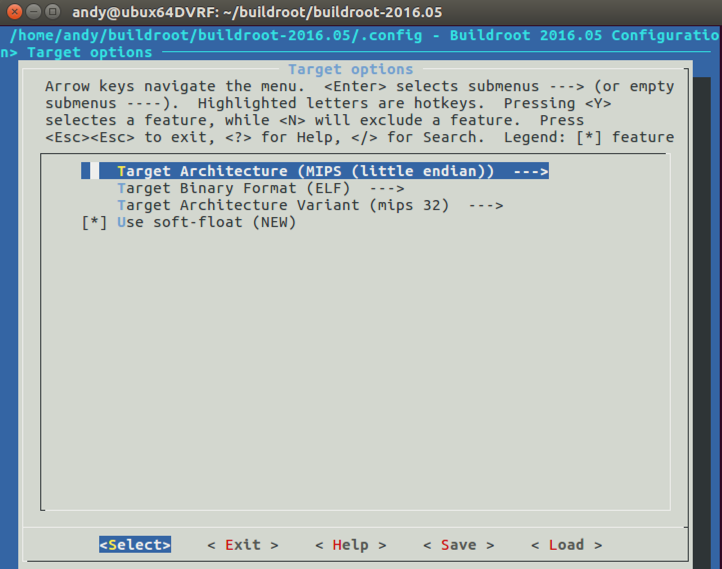
  12. In the menu prompt, press enter to select the Target
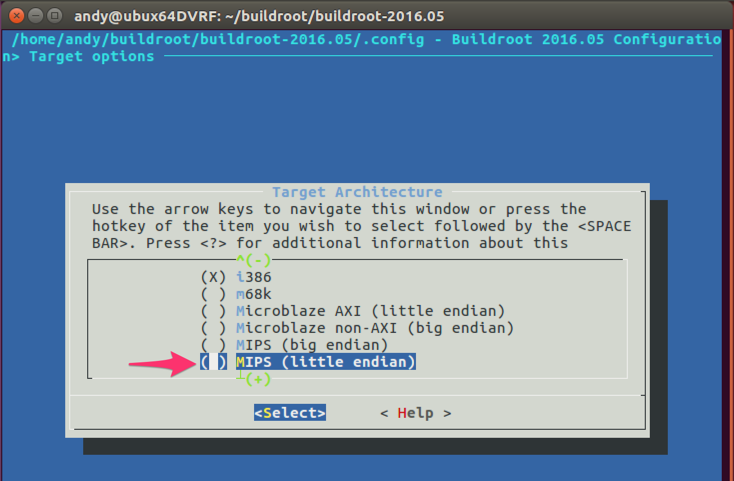
  13. Press the down arrow until you see MIPS (little endian)
  14. Press the spacebar to select the MIPS (little endian) selection

  15. Once this selection is made, the menu should return you to the main target selection screen and have automatically changed the binary format to ELF and the architecture variant to mips32.

  16. Press the escape key twice to return to the parent menu
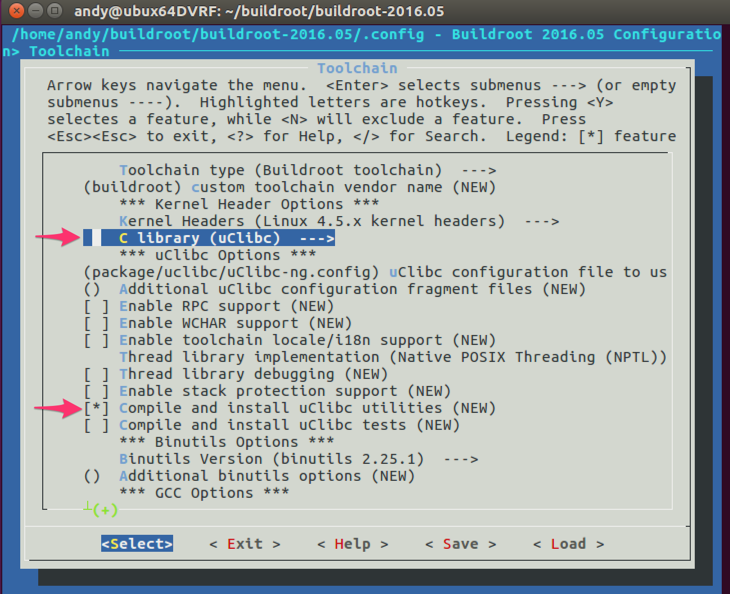
  17. At the parent menu, press the down arrow to go into the "Toolchain" menu and press the enter key
  18. Under Kernel Headers, you should see the "C Library" line item. Ensure the "uClibc" C library is the one selected. Make sure that "Compile and install uClibc utilities” option is also selected.

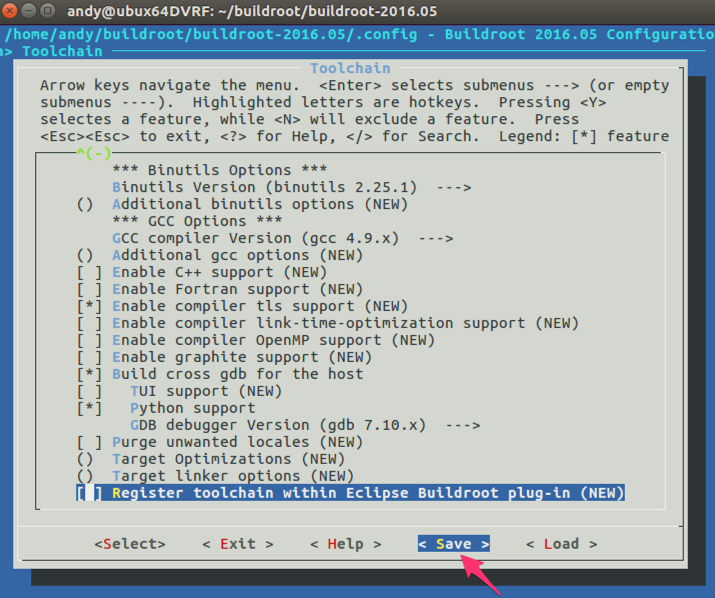
  19. Scroll down the list to the "GCC Options" section and press the spacebar on the "Build cross gdb for the host" line item. This will be needed to ensure that the gcc variant for mips32 will work. Once you select the cross gdb option, an additional menu will pop open. Press the spacebar on "Python support" to select that option as well.

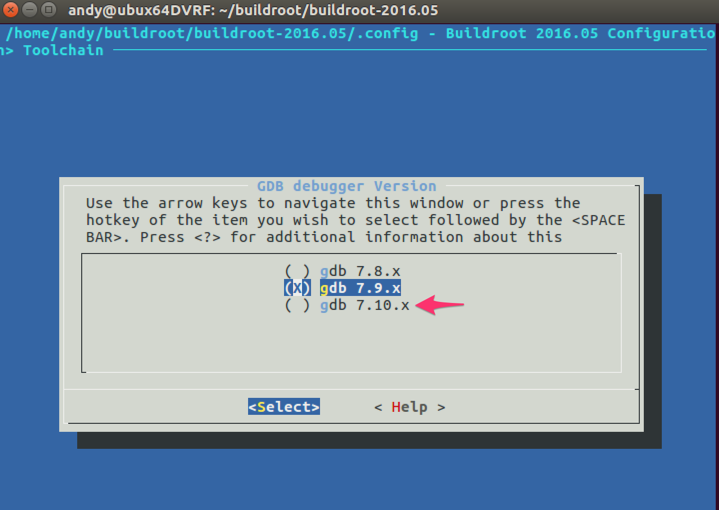
  20. The default gdb option is for the 7.9 version. Let's use an updated version of gdb. At the gdb line, press enter to enter the gdb menu. Here we have three options, press the down arrow to the 7.10 version and press the spacebar to select this option.

  21. Once the option for 7.10.x is selected, you will return to the prior menu
  22. Press the right arrow to change the menu at the bottom. Go to the "Save" option and press enter to save our configuration.

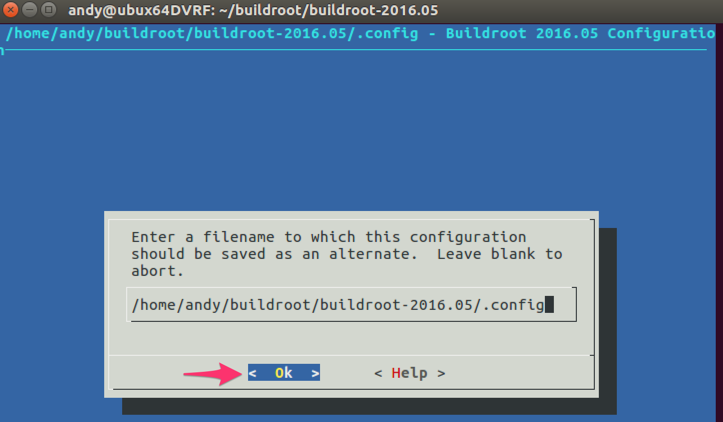
  23. We can leave the configuration name with the default settings or you can change it to a more appropriate filename.

  24. Press enter to save the configuration.
  25. Press the escape button twice to return to the parent menu
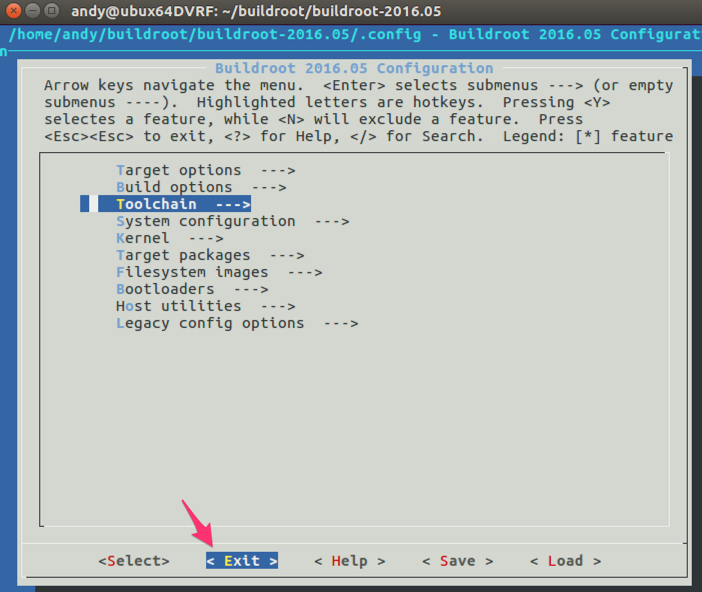
  26. At the parent menu, press the right arrow key to the “exit” option.

  27. Press enter to exit the application.
  28. Now we should have a configuration ready to use to do the actual installation of buildroot

  29. In Terminal, type in:
    make
  30. At this point, buildroot will be grabbing files from the Internet, configuring buildroot to our MIPS architecture configuration, and whatever else happens in the process! This will take awhile (roughly 45 minutes on my virtual machine).
  31. Once buildroot is done, a new directory called “output” will be created. This directory contains all of the files that buildroot created from the configuration in the prior steps.

Tuesday, July 26, 2016

Cybati - Blackbox Challenge #1 - Advanced Mission #15

This post is blog post 15 of 15 of the Cybati Blackbox #1 challenge.

Mission 15:
Mission 15 (10 pts). Describe findings of the two VMEM files located in the /opt/CybatiWorks/Labs/volatility directory. The files are titled CybatiWorks Windows*.vmem.


  1. This mission asks us to analyze two memory samples and to describe any of our findings. Let’s get to the appropriate directory begin our work. We should be in the /opt/CybatiWorks/Labs/volatility folder in the file browser window as below.

  2. In the above screenshot, we can see a bunch of Bash scripts that seem to be related to the memory dumps from the Windows 7 machine. Feel free to run the exiftool_1.sh Bash script to get file details of the ControlFlash.exe file as referenced in Mission 14. I did not get any data back when I ran hashdump_1.sh. But, let’s run the malfind_dump_1.sh Bash script to see what that returns. This is the same as malfind_1.sh, but this will also dump process information into a subfolder (CybatiWorks-1\malfind).

  3. While the above information is interesting and so is the rest of the output, there is nothing too interesting. ControlFlash.exe is mentioned a few times in the rest of the text, but without any context from Mission 14, this could be normal activity.
  4. Let’s continue to go down the list of tools and get their output. In Terminal, run:
    ./modules_1.sh

  5. There’s some interesting data, but nothing too relevant at the moment for what we need to focus on. Let’s run the next one, in Terminal, run:
    ./netscan_1.sh

  6. This volatility plugin returns much more interesting information. Now if we didn’t know what this program did, this may be expected activity. But, the IP addresses should certainly be investigated to determine if this is expected network activity, especially for this program. Let’s run the next one, in Terminal, run:
    ./pslist_1.sh
  7. As we can see above, cmd.exe and conhost.exe were both called shortly after ControlFlash.exe was ran. This could be normal activity, but this also seems a bit suspicious. Let’s run the next one, in Terminal, run:
    ./psxview_1.sh


  8. The above screenshots do not exactly line up, but these programs running in the bottom screenshot seem to indicate suspicious activity is going on. The previous command helps to identify hidden processes that may be running which could be an indication of malicious activity. Let’s run the next one, in Terminal, run:
    ./yarascan_1.sh

  9. This looks like an unfortunate situation has occurred on this machine with the compromised ControlFlash.exe from Mission 14. Yara was paired up to investigate this memory dump along with the meterpreter yara signature. Volatility was able to find patterns in this memory dump relating to an active meterpreter session. This information should provide the answer of the findings for the first memory dump for Mission 15.
  10. For the second memory dump, let’s start out with a similar methodology of using the pre-defined Bash scripts to help us analyze the data.
  11. The Bash scripts starting with “be2” seem to relate to a possible BlackEnergy 2 memory dump sample. Let’s start with the “cmdline_2.sh” Bash script. In Terminal, the current working directory should still be “/opt/CybatiWorks/Labs/volatility”. In Terminal, run the following command:
    ./cmdline_2.sh

  12. From the above command, there is nothing blatantly sticking out as an issue. Let’s run the next command in Terminal:
    ./cmdscan_2.sh

  13. If you click on the “cmdscan” in the above step, you see that the “cmdscan” command basically lists the command ran in cmd.exe. In the above screenshot, we can see that only 15 lines are returned from the grep matching the process ID of 1244. If we increase this to 40 (e.g. egrep ‘Pid: 1244’ -A 40) we can see all of the commands ran in this particular session as below:
    volatility -f CybatiWorks\ Windows\ 7-72420278-2.vmem --profile=Win7SP0x86 cmdscan | egrep 'Pid: 1244' -A 40
    (showing cmd lines #11 through #37)

  14. Based on the above two screenshots there appears to be some kind of manual PowerShell script building with network connectivity inside the PowerShell script. This is then fed to a Visual Basic script to perform some unknown task. While not completely out of the realm of normal administrative activity, this could be an issue of something bad happening. Let’s run the next Bash script in Terminal:
    ./malfind_2.sh

  15. From initial inspection of the output from this script, there’s nothing really standing out as an obvious indicator of an attacker. Let’s run the next Bash script in Terminal:
    ./malfind_dump_2.sh
  16. The output from this command is very similar to the above screenshot, but also dumps out the processes to a subfolder similar to the previous memory dump. Let’s run the next Bash script in Terminal:
    ./modules_2.sh
  17. A quick scan of the output from the previous command does not produce anything that pops out readily. Let’s run the next Bash script in Terminal:
    ./netscan_2.sh

  18. Interesting but not helpful information is provided. If we try to match the above output to what we saw in the cmd history, we do not find any matches. Searching for the PID and IP address references in the cmd history does not turn up any results with this command.

  19. Let’s run the next Bash script in Terminal:
    ./pslist_2.sh

  20. The second screenshot above seems familiar from a previous script output. Based on the “cmdscan” output, we saw that conhost was the console host for cmd.exe. Now we can see the associated PID with the cmd.exe (4504) that is more interesting to us. Let’s run the next Bash script in Terminal:
    ./psxview_2.sh
  21. The command output from psxview does not produce anything too different than the previous output. There were no image names not running in pslist that were available in the other commands. Let’s run the next Bash script in Terminal:
    ./screenshots_2.sh


  22. The above command created screenshots based on the memory dump, placed them in the indicated directory and opened up a file browser window in the directory with screenshots. The only screenshot that contained any info was “session_1.WinSta0.Default.png” as below.

  23. The window above looks like some kind of driver is being installed into the system with administrative privileges. From what we have seen so far, that could be expected activity although there does seem to be some potentially malicious activity happening on this system. Note, here are some quick articles about sessions in Windows (e.g. explaining WinSta0):
    https://blogs.technet.microsoft.com/askperf/2007/07/24/sessions-desktops-and-windows-stations/
    http://stackoverflow.com/questions/308135/how-can-i-enumerate-the-open-windows-enumwindows-of-another-user-session
    https://brianbondy.com/blog/100/understanding-windows-at-a-deeper-level-sessions-window-stations-and-desktops
    http://www.codeproject.com/Articles/35773/Subverting-Vista-UAC-in-Both-and-bit-Archite
  24. Let’s run the next Bash script in Terminal:
    ./virustotal_cybatiworks-2.sh

  25. A screenshot from VirusTotal is popped up to the screen with the above command. In the screenshot, all of the process dumps from the malfind_dump command appeared to have been submitted to VirusTotal. All of the process dumps seem to be fine and do not trigger any hits from the anti-virus vendors.

  26. We did get an interesting screen above where we can see drivers being installed. We don’t see a yarascan Bash script for our second memory dump. Copy yarascan_1.sh, paste it and rename it to “yarascan_2.sh”. Right click on “yarascan_2.sh” and click “Open With > Leafpad”.

  27. In Leafpad, change the memory dump name from “1.vmem” to “2.vmem” as below:
    #!/bin/bash
    echo "volatility -f CybatiWorks\ Windows\ 7-72420278-2.vmem --profile=Win7SP0x86 yarascan -y meterpreter_mem.yar"
    volatility -f CybatiWorks\ Windows\ 7-72420278-2.vmem --profile=Win7SP0x86 yarascan -y meterpreter_mem.yar
  28. Save the file and close Leafpad
  29. Let’s run the next Bash script in Terminal:
    ./yarascan_2.sh


  30. From the above screenshots, it would appear that the Rs500.exe process has been injected with a Meterpreter reverse TCP stager shellcode.
  31. If we go into the /opt/CybatiWorks/Labs/volatility/CybatiWorks-2 folder, we can see a PNG image called “kautilya_active.png”. If we double click on it, we can see a tiny command window without seeing any of the screen.


  32. My guess would be that is the window referenced earlier as “FolderView” and “Administrator: Installing Drivers” in step 22.
  33. If we go into the wlan_key folder, right click on “wlan_key.io” and open with LeafPad we will see code that we saw in steps 12 and 13.


  34. If we do a Google search on the name of the screenshot from step 31 we can eventually find the original code at
    https://github.com/samratashok/Kautilya/blob/master/lib/src/wlan_key.ino
  35. It would appear that an attacker used the Kautilya platform for an attack directed at getting the wireless key and possibly performing other attacks. Perhaps the attacker used a Teensy that was weaponized with Kautilya as referenced. Additional information on Kautilya can be found at:
    https://github.com/samratashok/Kautilya
    https://media.blackhat.com/bh-ad-11/Mittal/bh-ad-11-Mittal-Kautilya_Teensy_Beyond_Shell-WP.pdf
    http://www.labofapenetrationtester.com/2016/02/kautilya-easy-reverse-shells.html
  36. The above information should help answer the findings for the second Windows memory dump for Mission 15.

Thanks!