Step 7: Analysis with pwndbg
This step covers the installation of pwndbg and simple testing with a challenge. Pwndbg is a great enhancement for GDB and truly makes debugging suck less. This is blog post 7 of x on learning with the DVRF project blog post series.
- Log into the VM
- In Terminal, browse to the Downloads directory. In Terminal, type in:
cd Downloads - We will get pwndbg from the Git repository. In Terminal, type in:
git clone https://github.com/pwndbg/pwndbg - Now that we have pwndbg cloned locally to our virtual machine, we can browse into the directory locally. In Terminal, type in:
cd pwndbg - In the pwndbg directory, we can install it. In Terminal, type in:
sudo ./setup.sh - The above command will pull down additional resources needed from the internet and install the necessary items. As this project relies upon things like Capstone, Unicorn, and Qemu those files will be among the items downloaded and installed into the pwndbg directory.
- Now we should be able to test if we get the default GDB, or if we get the pwndbg flavored GDB. In Terminal, type in:
gdb - It looks like something is broke. In GDB, type in:
quit - From the stack trace above, it looks like the problem line is 661 in the /usr/local/lib/python3.5/dist-packages/capstone/__init__.py file. There is a version mismatch with Capstone causing the issue. We can either open up that file above and comment out line 661 (it’s a raise exception line) or uninstall all Capstone versions and reinstall with sudo ./setup.sh. This step will go with the first option of commenting out the raise exception line.
- In Terminal, type in:
sudo gedit /usr/local/lib/python3.5/dist-packages/capstone/__init__.py - In gedit, there should be a line at the bottom for status information:
- Click on “Display line numbers” if the box is unchecked
- Scroll down to line 661 (if that is the same number as above in the stack trace)
- At the beginning of “raise CsError”, put in a # symbol. This is normally not a practice I would recommend and would rather go through the process of removing Capstone and re-installing with the pwndbg tools. Again, the problem with pwndbg is an issue with the different versions of Capstone on the system. There is an open ticket (at the time of this writing) with pwndbg to not stomp over pre-existing versions of Capstone. At the time of this writing, this feature is not in place yet which may alleviate this problem in the future. Since this is a test VM for learning and not a critical system, this should be fine. The addition of “#” should look like below.
- At the top right of gedit is the “Save” button. Click that.
- Close gedit by clicking on the red button at the top left of gedit
- Back in Terminal, type in:
gdb - If all is well enough, you should see the following below:
- Yay! Now we can go do debugging stuff. We know from prior steps that the binary files for the challenges in the firmware are little endian and on the MIPS architecture. Let’s see how GDB is currently configured and then set as necessary.
- In GDB, type in:
show arch - It looks like GDB is defaulting to i386 for the target architecture. Let’s check the endian-ness. In GDB, type in:
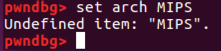
show endian - At least the endian order is what we want. We can change the target architecture by setting it. In GDB, type in:
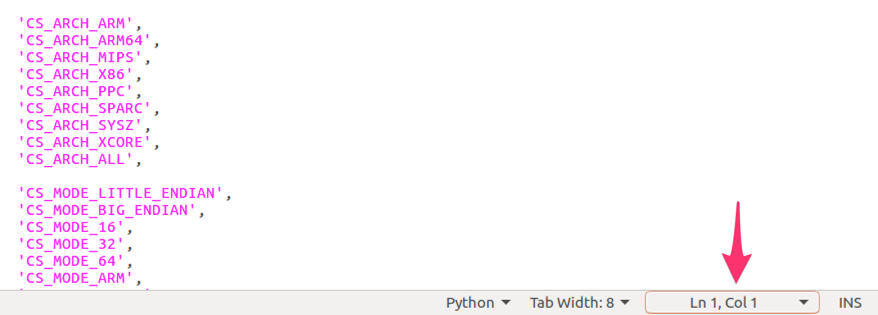
set arch MIPS - Let’s try to see if we could set the architecture to something else. In GDB, type in:
set arch - Based on the above screenshot, it looks like the architectures are based on x86. We need more GDB! In this case, we need gdb-multiarch. In GDB, type in:
quit - In Terminal, type in:
sudo apt-get install gdb-multiarch - Once gdb-multiarch is installed, type in Terminal:
gdb-multiarch - In GDB, type in:
set arch - There we go. Now we have more options. If we run “show arch” and “show endian”, we see the same as before.
- Let’s load up the stack overflow program from the pwnable/Intro directory. In GDB, type in:
cd .. (press Enter)
cd DVRF-master/Firmware/_DVRF_v03.bin.extracted/squashfs-root/pwnable/Intro/ (press Enter)
target exec ./stack_bof_01 (press Enter) - Now we have attached to a challenge, let’s see if the architecture has changed. In GDB, type in:
show arch - Now we have the appropriate architecture for GDB to correctly interpret the binary and was changed automatically.
- In GDB, type in:
quit - In one Terminal, type in:
cd (press Enter)
cd Downloads/DVRF-master/Firmware/_DVRF_v03.bin.extracted/squashfs-root (press Enter)
sudo chroot . ./qemu-mipsel-static -g 1123 pwnable/Intro/stack_bof_01 "Hello" (press Enter) - The above step will get us with a GDB stub that we will connect to with another Terminal running GDB. Open another Terminal, and type in:
gdb-multiarch - Let’s check the architecture and endian-ness to see what they are. In GDB, type in:
show arch (press Enter)
show endian (press Enter) - It is important to be aware of the architecture of what GDB think it’s in as compared to the binary is being processed. Let’s hook up this GDB to the GDB stub from the other Terminal window. In GDB, type in:
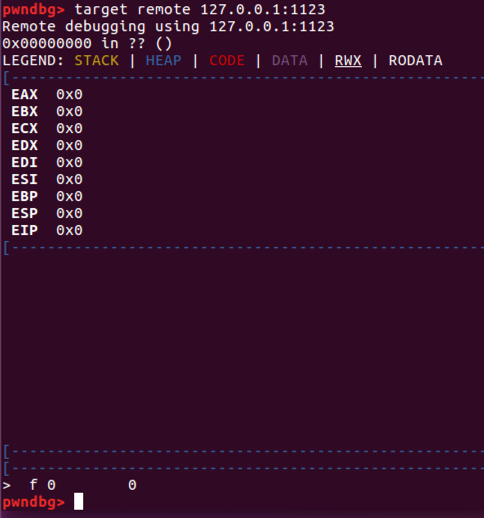
target remote 127.0.0.1:1123 - This is looking pretty empty. Depending on your process and workflow, you may just run the program once to get a feel for how things operate. Let’s try that and see what happens. In GDB, type in:
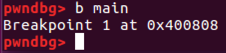
run - It does not appear this is going to work as we expect for a remote GDB session. Let’s try to set a breakpoint on the main function and try to “continue”. In GDB, type in:
b main - We are not able to discern symbols from the “remote” file to help us out. That could be problematic. Let’s try to use the file command (informational links here, here, and here) to see if we can get more information. We can use the file command to point to the local copy of the binary to see if that helps us out. Be sure to type in the complete path to the binary and your path may be different than the one below. In GDB, type in:
file /home/andy/Downloads/DVRF-master/Firmware/_DVRF_v03.bin.extracted/squashfs-root/pwnable/Intro/stack_bof_01 - If we take a look at the architecture, we should now have the correct architecture aligned with our binary. In GDB type in:
show arch - Now that we have gone through and checked things, it would be nice to get that nice split screen view of the action again. But, without knowing the command to get that, it may be a little bit difficult. At the beginning, we saw that pwndbg loaded up additional commands for our use. We can see the pwndbg specific commands by typing in GDB:
pwndbg - Not all of the commands were shown, but the one we want is “context”. In GDB, type in:
context - Let’s set a breakpoint on the main function. In GDB, type in:
b main - That looks better than last time! Let’s continue the execution of the program. In GDB, type in:
continue - The above command produced a lot of screen output as below:
- We can see that a lot is going on with how GDB and pwndbg has disassembled this binary. For now, in GDB, type in:
quit - The registers, stack, and the rest of it does not look familiar from an x86 perspective. Rather than trying to figure out the challenge while trying to figure out MIPS, let’s take one challenge at a time. Let’s check out MIPS!


No comments:
Post a Comment