Step 10 - gdb, you know me!
Now that we have a good understanding of MIPS assembly, let’s run the “hello” program through GDB that has extra flavor with pwndbg and make sure it’s in a good place for debugging. This is blog post 10 of x in the learning with DVRF project series.
Part 1: Let's get "hello" attached
- Log into the VM
- Open up a Terminal
- Browse to the squashfs-root directory. In Terminal, type in:
cd
cd Downloads/DVRF-master/Firmware/_DVRF_v03.bin.extracted/squashfs-root/ - Now we need to set up the Qemu environment to run our binary in a simulated MIPS environment. In Terminal, type in:
sudo chroot . ./qemu-mipsel-static -g 1144 ./pwnable/Intro/hello - The Terminal window in the previous step is actively running and waiting for a debugger to attach to the running process. The “-g” switch we used against the Qemu binary asked Qemu to launch the process in the simulated MIPS environment and open up a “stub” connection to a debuggable process (in our case, the “hello” binary). This switch will allow us to connect from GDB (or another applicable debugger) to the debuggable stub on port 1144 on the IP address of the host. Here is the description from the Qemu binary on the “-g” option:
- Open up another Terminal window
- In this second Terminal window, type in:
cd
cd buildroot/buildroot-2016.05/output/host/usr/bin - To help us with future steps, let’s open up objdump with the disassembly of the “hello” binary. In the second Terminal, type in:
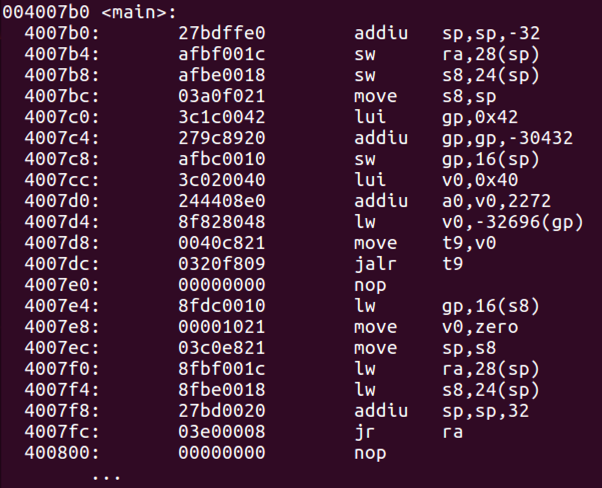
./mipsel-linux-objdump -d /home/andy/Downloads/DVRF-master/Firmware/_DVRF_v03.bin.extracted/squashfs-root/pwnable/Intro/hello - In the objdump disassembly, browse to the “main” section
- Now that we have the stub actively listening for the debugger to attach to the process and the disassembly in another window, let’s open a third Terminal window. In the third Terminal window we will use GDB with the pwndbg addition to actively step through the actively running “hello” binary. All of this is done…. actively.
- Open up a third Terminal window. In the third Terminal window, type in:
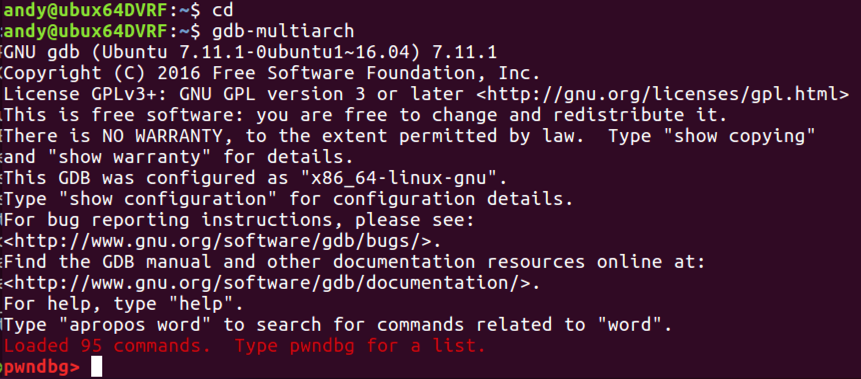
cd
gdb-multiarch - We should have a successfully loaded a GDB/pwndbg session which is ready to attach to the stub in the first Terminal window:
Part 2: What do we "C"?
- In pwndbg, type in:
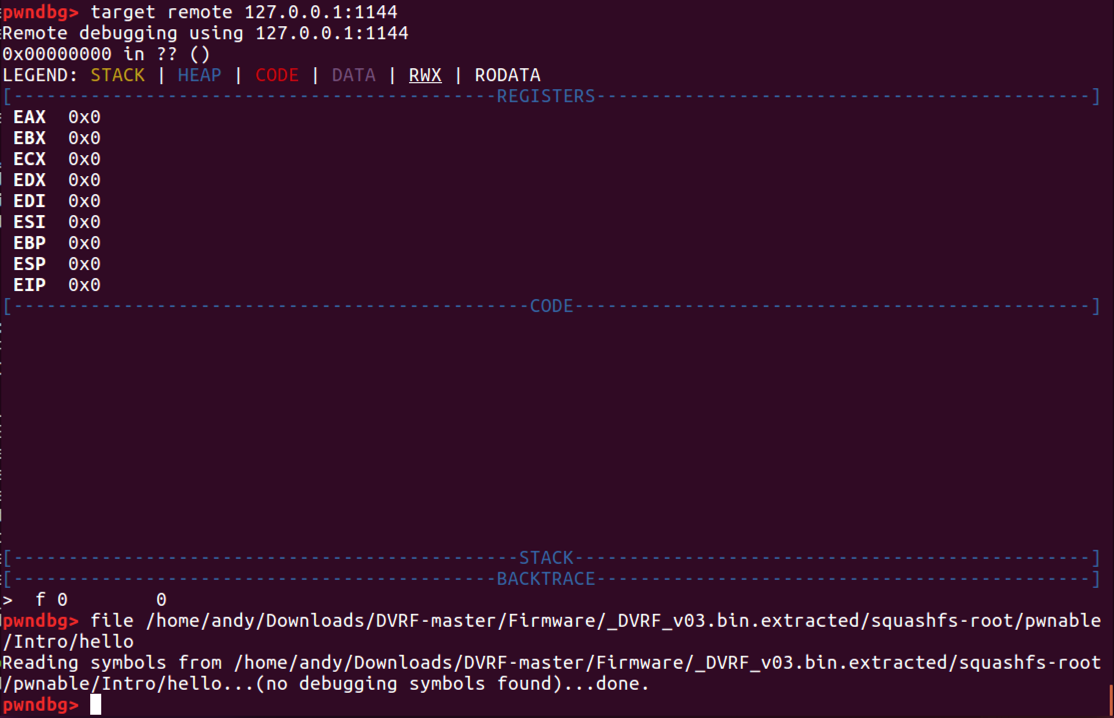
- target remote 127.0.0.1:1144
- The target command should connect to the debugger stub session on the local IP address (127.0.0.1) on port 1144. Note: I’m randomly picking ports when I do this. Feel free to use whatever and won’t conflict with whatever else is running on the system.
- The process hasn’t been started yet in the first window. However, we need to match up the almost-running process in the first Terminal window to the symbols of the “hello” binary. The symbols are what helps us “translate” the machine code to more human readable output. We need some way to match up what we see in the disassembly in GDB/pwndbg to a more friendly way of what we see in the objdump Terminal window. Since we did not strip the symbols in the compilation of the “hello” binary, we can attach our GDB/pwndbg session with the binary on disk. In the GDB/pwndbg Terminal window, type in:
- file /home/andy/Downloads/DVRF-master/Firmware/_DVRF_v03.bin.extracted/squashfs-root/pwnable/Intro/hello
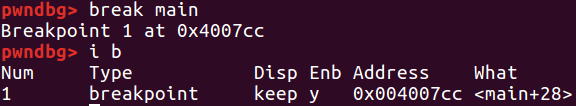
- In many first run cases, we want to set a generic breakpoint to the “main” function of a program. We will let the program go through other preliminary phases and land automatically on the “main” function. In the previous step, we let our mapping to the actual “hello” binary help us map to the memory location of the beginning of the “main” function. With that, let’s set create a breakpoint to the “main” function so we can start stepping through execution from that memory address. In GDB, type in:
break main
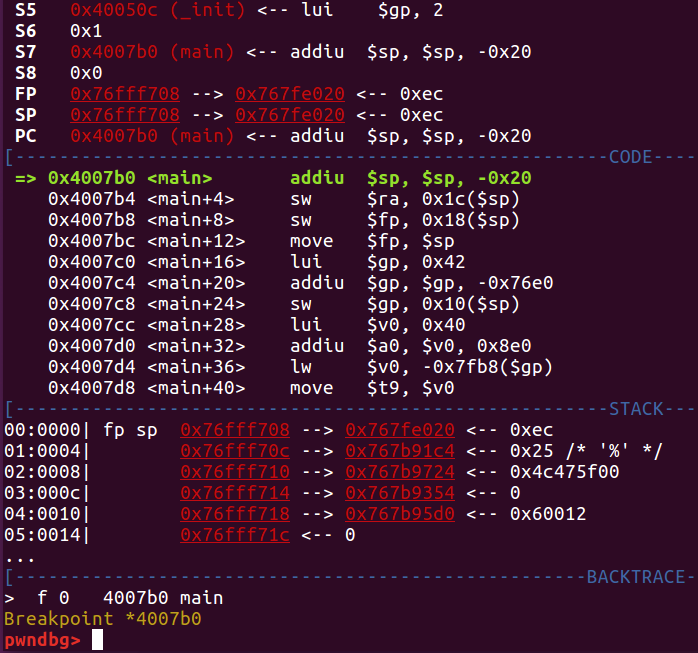
- With this proceeding step, I am getting odd behavior sometimes as gdb/pwndbg thinks the entry point for “main” is way off. The breakpoint is many times set on a memory address 8 or so instructions into the “main” function. This is what I see now:
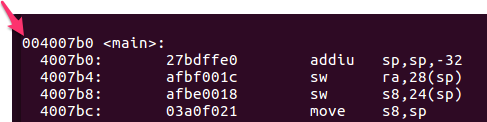
- I’m not really too worried about it right now. The better way and especially so for this example is to set it to the memory address of "main" from objdump. If we take a look at the Terminal window with objdump, we can see the memory address associated with “main”. Since we don’t have ASLR or anything else on right now, this should be the same address we see in the pwndbg/gdb window.
From objdump:
- In pwndbg, type in:
break *4007b0
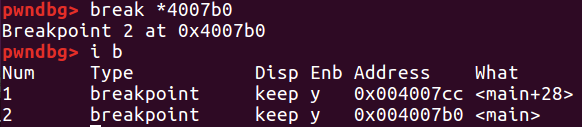
- In the preceding step, we are setting a breakpoint at a specific memory address with the “*” and the hexadecimal memory address. If we wanted to see our currently set breakpoints, we can type in:
info breakpoints
Or
i b
- Let’s not have two breakpoints as that would be annoying since they’re in the same function (main). In the above screenshot we can see that at this point, the second breakpoint knows it's at the top level of the main function. So helpful! Let’s remove the first breakpoint so we just hit the breakpoint upon settling into main. In pwndbg, type in:
del break 1
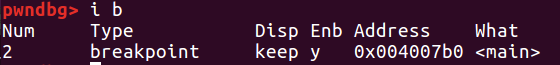
- Let’s verify we just have one. In pwndbg, type in:
i b
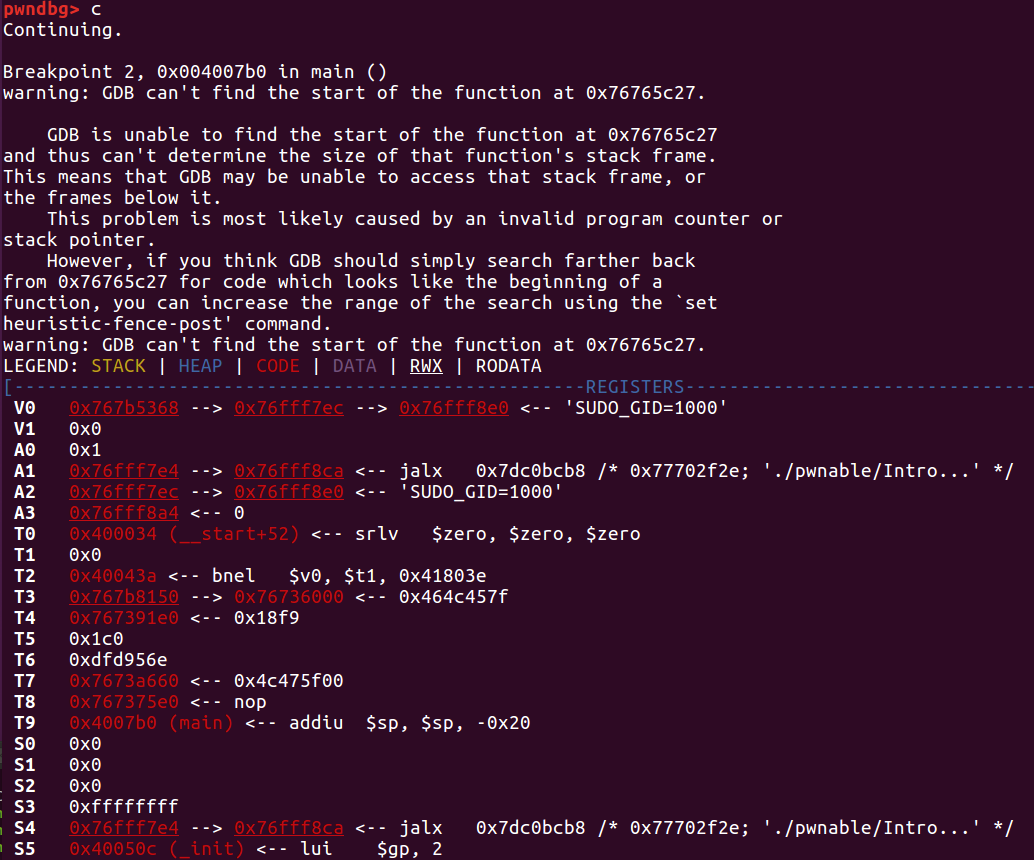
- Let’s actually run this program now! In pwndbg, type in: c
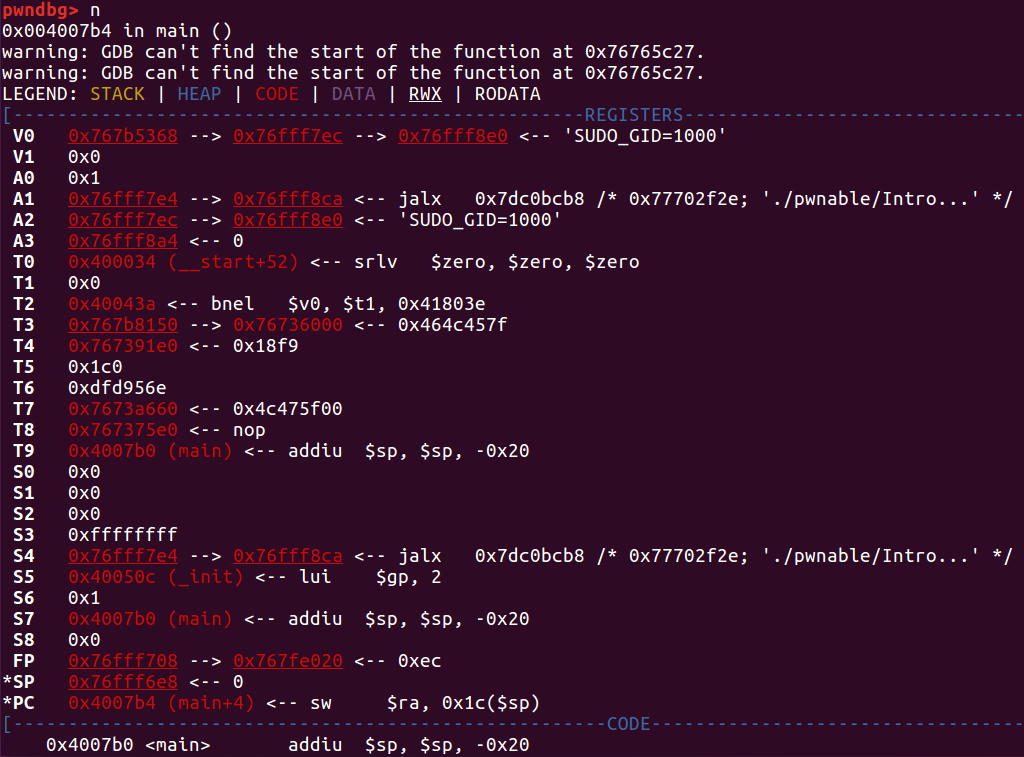
- We get a lot of text right away that flies up. If we scroll to right below the “c” from above, we see pwndbg/GDB have some issue with referencing a function.
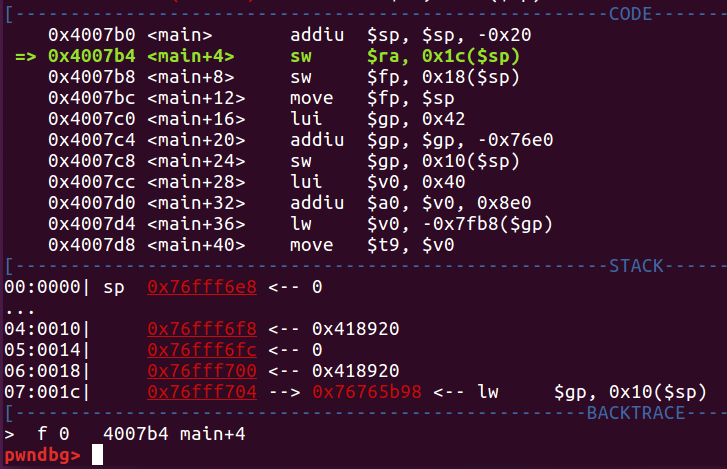
- The C libraries that we are using in pwndbg/GDB are not the same C libraries that Qemu is using with the emulated environment hosting the “hello” binary. Enter in “n” to proceed with the next step of execution:
n
- pwndbg/gdb seems to be working without the reference to the uClibc library. However, we should point pwndbg/gdb to the same library as a better reference point. We can use “set solib-search-path” to the “lib” file path within the squashfs folder structure. We can see right now what our search path is set to with “show solib-search-path”:
- We can set the path with set solib-search-path and continue on in our pwndbg session. Or we can start fresh with the appropriate configurations done in the beginning before we start stepping through the program. I’m going to go ahead and start fresh again. In pwndbg, type in: q
- The preceding step should stop pwndbg/gdb as well as terminate the Qemu gdbstub session.

No comments:
Post a Comment