This post is blog post 3 of 15 of the Cybati Blackbox #1 challenge.
Step 3:
Instruction: Passive Host Discovery. Use Wireshark within the Industrial Network to baseline active host-to-host communications. Close Wireshark when complete.
Step 3:
Instruction: Passive Host Discovery. Use Wireshark within the Industrial Network to baseline active host-to-host communications. Close Wireshark when complete.
Mission 4 (5 pts). Identify the active connections to the HMI.
- The previous step asked for active network scanning analysis and now we will shift to passive network scanning analysis with Wireshark. The question for Mission 4 asks to see a baseline of network activity as it relates to the HMI.
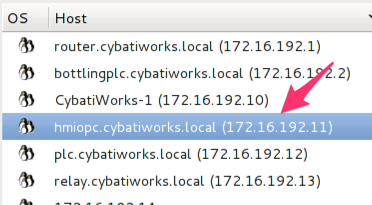
- In Zenmap, we can see a host named “hmiopc.cybatiworks.local” in the list of hosts.
- In the above screenshot, it appears that the HMI has an IP address of 172.16.192.11. Minimize Zenmap and click on the “Click to Launch” to open the file directory window.
- Double click on “3. Passive Host Discovery (WIZARD)” to begin working on Step 3.
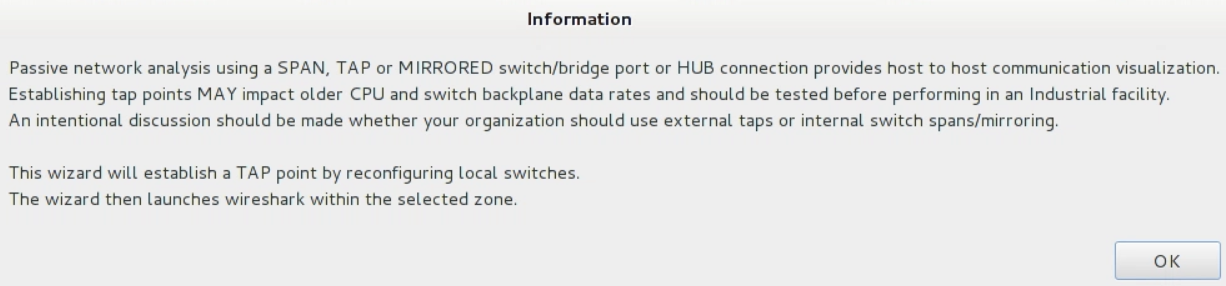
- A warning popup box appears informing the user how an analyst could passively gather network information with a SPAN or TAP device. The wizard will configure the local virtualized switches and then open Wireshark to perform passive network analysis. Click “Ok” to proceed with the configuration.
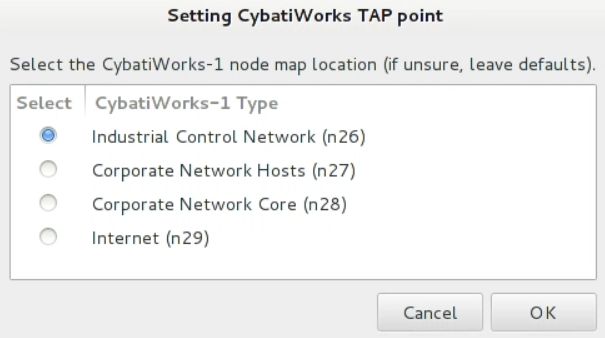
- An option popup box appears asking which network segment we would like to configure a virtual TAP device. We will stay with the “Industrial Control Network” selection and click “Ok”.
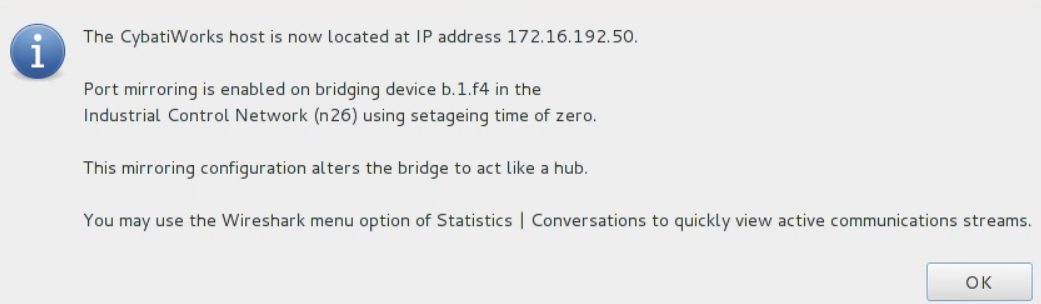
- An informational popup box will appear letting us know of the network configuration changes. Wireshark may pop up before you have completed reading the text, but this will be ok. Let Wireshark continue to load and begin with passive network analysis.
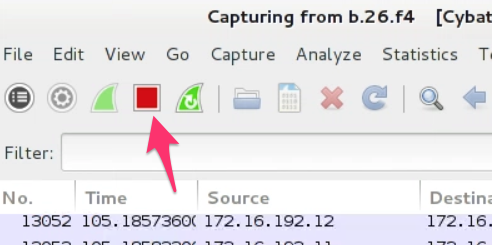
- Once Wireshark opens, you may begin to see the middle screen scroll with lots of network information. Let’s stop the analysis for now so we may investigate the tool. Click the red “Stop” button in the upper left hand corner.
- Wireshark should no longer be passively collecting network information and the middle window should no longer scroll. At this time, you can click on the “Information” window at the bottom of the screen to fully read the text presented in the popup box.
- The full “Information” popup window has the following information:
- As we identified in step 2, the HMI has the IP address of 172.16.192.11. Go back to Wireshark if needed and scroll up in the middle window. Here you will see network traffic where the HMI host (172.16.192.11) is either in the “Source” or “Destination” column.
- To answer the question in Mission 4, in Wireshark, left click on “Statistics” at the top, but hold down the left click button. You will need to hold down the button and hover over “Conversations” in the list. Once your mouse cursor is over “Conversations”, let go of the left mouse button to open up the “Conversations” window.
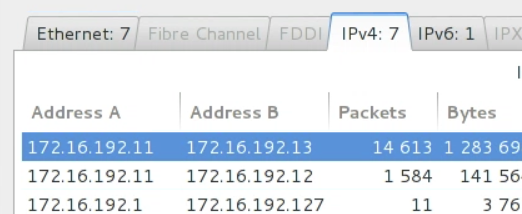
- Once you have the “Conversations” window open, we can see the active IPv4 network conversations by clicking on the “IPv4” tab.
- Here we can see all of the network connections that were active with the HMI host. In this case, there were two active network connections to the HMI with IP addresses of 172.16.192.13 and 172.16.192.12. This is how you would answer the question for Mission 4.
- Close this window by clicking “Close” and exit Wireshark by clicking “File | Quit”. Click “Quit without Saving” if you would like to discard this network capture.


No comments:
Post a Comment