A fun way to reverse engineer a binary is to run it attached to a debugger. A common debugger used on Linux is the venerable GDB application. There are many options for a dissembler, but first we will use readelf and objdump as they’re free and remain as valuable tools to master.
Let’s recap the phases to explore with the stack buffer overflow challenge:
Phase 1 - Run it to see how it works
Phase 2 - Run floss/strings - Initial static analysis
Phase 3 - Examine it with readelf/objdump - More static analysis
Phase 2 - Run floss/strings - Initial static analysis
Phase 3 - Examine it with readelf/objdump - More static analysis
Phase 4 - Examine it with gdb/pwndbg - Dynamic analysis
Phase 5 - Exploit it
Phase 5 - Exploit it
Phase 3 - Examine it with readelf/objdump - More static analysis:
- In this phase, we will do a little more static analysis with the binary to learn more about this program to attack it in phase 4. We could throw garbage, 40,000 “A”s, or whatever and we may never get to where we need to be, to beat the challenge. We could get lucky and smash it with A*40000, but it’s not very efficient to manually throw various characters at it. If we can (and the binary isn’t giant like Mozilla Firefox), it may be easier to examine the program in a static and disassembled form as well as dynamically with a debugger to get a better idea of what we can do.
- As implied with the phase name, let’s start by examining the binary with readelf
- In Terminal, browse to the pwnable/Intro folder:
cd
cd Downloads/DVRF-master/Firmware/_DVRF_v03.bin.extracted/squashfs-root/pwnable/Intro/ - We need to use the readelf version from buildroot. In Terminal, type in:
/home/andy/buildroot/buildroot-2016.05/output/host/usr/bin/mipsel-linux-readelf -a ./stack_bof_01 - Scroll down to the bottom to find similar information that was helpful to us in the blog post for step 9. Here we can see system, puts, printf, and strcpy as functions in the global entries section. We also see the canonical gp value of 0x00448cd0. Exciting!
- There’s nothing else interesting nor helpful at this time for us to examine in the rest of the readelf output. Let’s move on.
- Let’s use objdump now. In Terminal, type in:
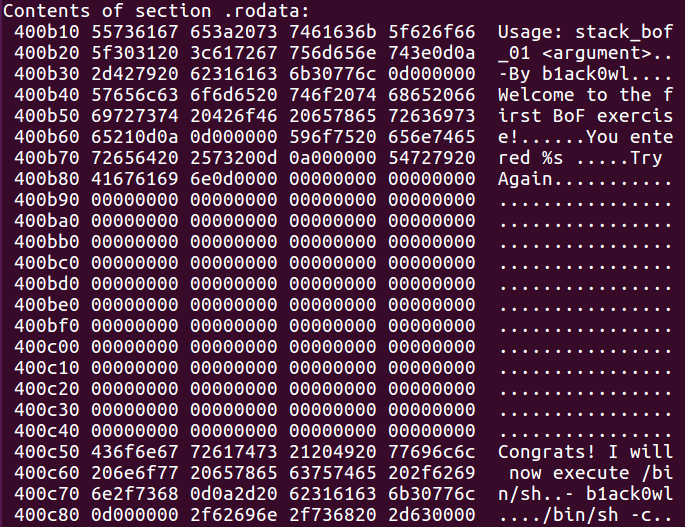
/home/andy/buildroot/buildroot-2016.05/output/host/usr/bin/mipsel-linux-objdump -s ./stack_bof_01 - Scroll up to the .rodata section and we can see the same strings we saw from floss:
- Instead of doing “-s” with objdump, let’s get a better view of the diassembly with “-d”. In Terminal, type in:
/home/andy/buildroot/buildroot-2016.05/output/host/usr/bin/mipsel-linux-objdump -d ./stack_bof_01 - We can see, as in previous steps, disassembled output of various functions of the binary. Scroll up to the <main> function starting at 004007e0. Browsing through this function, we can see this function is larger than previous main functions we have gone through. In addition, there are new opcodes such as slti and beqz that were not previously seen.
- If we keep on scrolling, we can see that there is a “<dat_shell>” function. Judging purely based on the name, this is probably some function that we want to somehow reach. If we look in the “README” file located in the pwnable/Intro folder, we see this text for the stack_bof_01 challenge:
“stack_bof_01 - This is your run of the mill Buffer Overflow. This DOES NOT require shellcode to win, there is a function compiled into the binary that is impossible to reach to normally. Your goal is to reach that function which will display a congrats message and execute /bin/sh.”
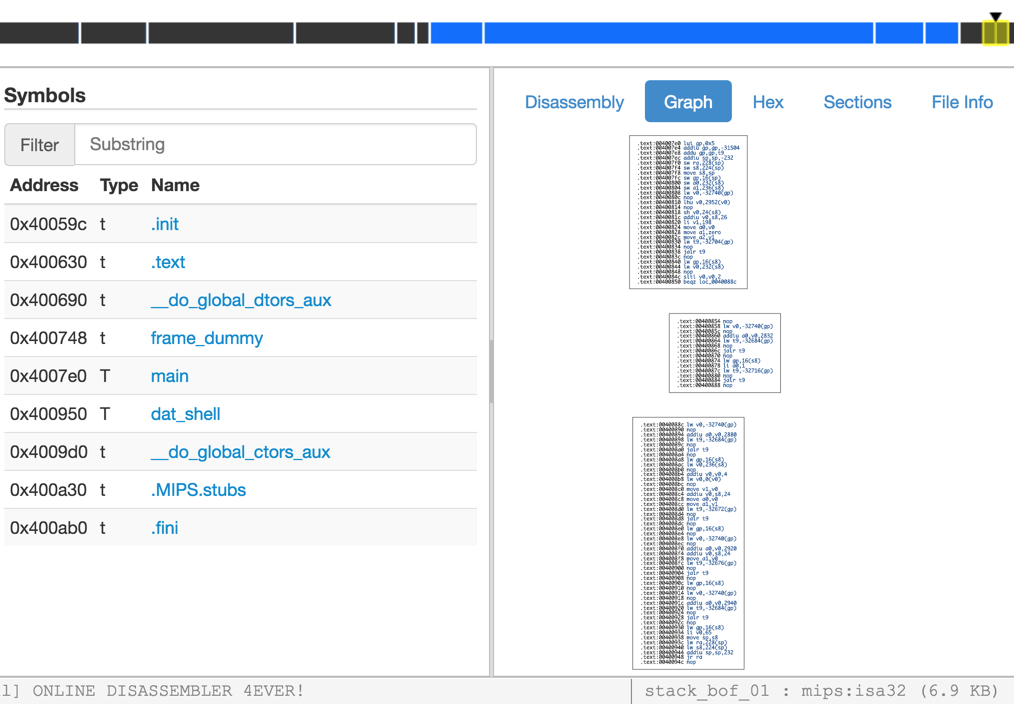
With this info, we know that <dat_shell> must be the function that is referenced above that we need to reach through some kind of stack smashing technique. Additionally, we can see the “Congrats” message in the .rodata section in step 8. This message is what we should see when we successfully smash the stack with the appropriate data. - As a quick note, if we open up this binary in Online Disassembler, we can see in the main function there are three sections in the screenshot below. The link below should bring you to the same stack_bof_01 MIPS binary from the DVRF project.
https://www.onlinedisassembler.com/odaweb/OXabeNP7 - As programs become more complex, we may not see main functions with a straightforward path of code execution. At this point, we could either step through each instruction through objdump or check it out in GDB. You could at this point choose to step through the program line by line with objdump or in some other form. However, we will take a deeper look at this program with GDB in the next post and see what we can find out with dynamic analysis.

No comments:
Post a Comment