Thanks to everyone who came out today for my talk! It was a lot of fun. I will work on making any adjustments to the slides from the talk today and get them posted. Once they’re posted, I’ll make a post with their location for future reference. Thanks again!
Thursday, September 29, 2016
Tuesday, September 27, 2016
Nebraska Cyber Security 2016 Conference
Where’s phase 3 for the stack buffer overflow!? It will come! Sorry, it’s been busy the last couple weeks. There’s been the CSAW qualifications that I participated in with a work team, DerbyCon, and Flare-On just started! Lot’s of activity in the community right now. The writeups for the DVRF series will continue soon! I will also convert my notes into writeups for the CSAW qualifications I solved along with the other challenges I was able to work on after the qualification finished up.
I have also been working on my presentation, which is this Thursday, at the Nebraska Cyber Security Conference in Lincoln, NE. You can find more information at their site along with a brochure of the scheduled talks. On page 3 of the brochure I am scheduled to speak at 1:45p and page 5 has the abstract of the talk below:
“This talk is an introduction for people looking to assess software within the firmware of a hardware device. Specifically, the talk will discuss the open source project, Damn Vulnerable Router Firmware, provide a brief overview of the MIPS CPU architecture and assembly language, give a brief rundown of MIPS disassembly with tools, as well as demonstrate how to pwn some of the intentionally broken binaries within the DVRF firmware. The firmware for this project can either run on an actual hardware device or be emulated in software. The talk would show how this can all be done in software to provide an easy way into the world of penetration testing of firmware on hardware devices.
As firmware on hardware continues to be more readily available (either from the vendor or by dumping it through hardware access), organizations and individuals need to assess the software within the firmware. Not a lot of attention has been focused on hardware and firmware vulnerabilities as we see with mobile and Web applications. This talk helps to provide more awareness of the vulnerabilities within firmware software and how people can get into this area of infosec.”
It should be a fun time with a lot of great talks there at the conference! If you’re there, come and say hi!
Thursday, September 15, 2016
Learning with DVRF - Step 13 - Stack buffer overflow - Phase 2
Step 13 - Stack buffer overflow - Phase 2
There are many ways people approach investigation and reverse engineering of a binary. A method that is still valid to perform is a “strings” against the binary. Who knows what kind of gems we can knock loose from performing a static analysis of a binary.
Let’s recap the phases to explore with the stack buffer overflow challenge:
Phase 1 - Run it to see how it works
Phase 2 - Run floss/strings - Initial static analysis Phase 3 - Examine it with readelf/objdump - More static analysis
Phase 4 - Examine it with gdb/pwndbg - Dynamic analysis Phase 5 - Exploit it
Phase 2 - Run floss/strings (static analysis):
- A possible second phase of testing is to examine the binary for any helpful strings that may be inside the binary. For instance, some CTF challenges may have the flag in cleartext that could be revealed with a simple “strings” examination. The “strings” program has different iterations from vendors/companies like SysInternals (owned by Microsoft) who make their own versions across operating systems. A strings program typically examines a binary for strings of text and other information (e.g. library information) and outputs that information. FireEye recently put out a new approach to “strings” which they call “floss”. In this phase, we will use floss to examine the challenge.
- You can download the standalone floss binary from FireEye's GitHub page. I have already downloaded the standalone copy of floss (1.3.0 at the time of this writing) and placed it in my Documents folder. You can place this binary anywhere convenient for you.
- Open up a new Terminal and browse to the location you have floss downloaded
- Run floss on the stack_bof_01 challenge file
- From floss, we can see a few things such as printf and the libc used:
- We can see specifically that a “strcpy” function call is within this binary. We can see from sources like OWASP, MITRE, Exploit-DB, and well known researchers that the “strcpy” function is prone to being exploited.
- A little bit further down we can see plaintext from within the binary:
- With this challenge, there is some interesting information gleaned from this phase. We see in the strings above that if we perform some kind of correct sequence of “something”, we can get a congratulatory message saying “/bin/sh” will be performed. However, from phase 1, we entered in junk data and did not get the good message. Instead, we got the echo statement (%s) of what we sent as input and a “Try Again” message. So this at least tells us that we need to do something to get past where we were stopped in phase 1.
- At the end of the floss output, we see the message “ERROR:floss:FLOSS currently supports the following formats for string decoding and stackstrings: PE”. Since this binary is an ELF file, we probably would not have been able to have any encoded messages decoded for us.


Tuesday, September 13, 2016
Learning with DVRF - Step 12 - Stack buffer overflow - Phase 1
Now that we have a good understanding of MIPS assembly, let’s work on the challenges within the DVRF project. The first challenge to examine and beat is the stack buffer overflow challenge. This is blog post 12 of x in the learning with DVRF project series.
The seminal background information for smashing the stack would be with Aleph One’s paper, “Smashing The Stack For Fun And Profit” from Phrack published in 1996. It is highly recommended reading:
http://phrack.org/issues/49/14.html
http://phrack.org/issues/49/14.html
A second but also important piece of background information comes from Corelanc0der’s “Exploit writing tutorial part 1: Stack Based Overflows”. This is also highly recommended for you to review:
https://www.corelan.be/index.php/2009/07/19/exploit-writing-tutorial-part-1-stack-based-overflows/
https://www.corelan.be/index.php/2009/07/19/exploit-writing-tutorial-part-1-stack-based-overflows/
The entire series for his exploit writing tutorial is excellent material. There’s a lot of material, but well worth the time and effort put into reading.
With some good background knowledge covered, we will approach this challenge with the following phases:
Phase 1 - Run it to see how it works
Phase 2 - Run floss/strings - Initial static analysis
Phase 3 - Examine it with readelf/objdump - More static analysis
Phase 4 - Examine it with gdb/pwndbg - Dynamic analysis
Phase 5 - Exploit it
Phase 1 - Run it to see how it works:
- Log into the VM
- Open up a Terminal
- Browse to the squashfs directory. In Terminal, type in:
cd
cd /home/andy/Downloads/DVRF-master/Firmware/_DVRF_v03.bin.extracted/squashfs-root/ - The first challenge to tackle is the stack buffer overflow program called “stack_bof_01” in the pwnable/Intro folder. To run this challenge, we need to have Qemu run it in an emulated environment. Let's run the challenge and see what happens. In Terminal, type in:
sudo chroot . ./qemu-mipsel-static pwnable/Intro/stack_bof_01 - It does not appear much happens without additional input to the program as it expects at least one argument
- Let’s give it an argument as the help text recommends. Let’s add in 7 “A”s as an argument to the program. In Terminal, type in:
sudo chroot . ./qemu-mipsel-static pwnable/Intro/stack_bof_01 AAAAAAA - Nope. This does not appear to be what we need to do. On to phase 2!


Thursday, September 8, 2016
Learning with DVRF - Step 11 - Part 5 - Let's get that GDB running
Step 11 - “Hello” GDB demonstrated in 5 parts
In the previous post, we were able to get the appropriate “pre-checks” done for GDB/pwndbg. We trudged through the steps necessary to get GDB/pwndbg correctly aligned with steps to get a better debugging experience. This post will briefly examine the “hello” binary in GDB/pwndbg and then go through each line step-by-step in GDB/pwndbg. This is blog post 11, part 5 of 5, of post x in the learning with DVRF project series.
Part 5: Now for the grand finale!
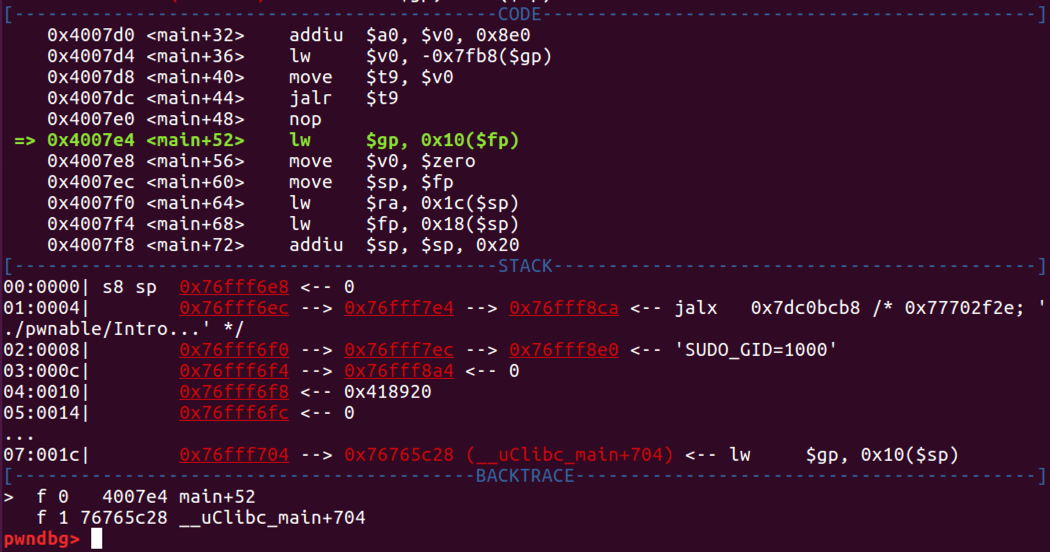
- Let’s recap where we’re at in our disassembled output. In pwndbg, type in:
context - Based on prior articles, we see that we have accomplished the meat of the program and will perform cleanup. The program will continue with loading the value that is at an offset of 0x10 from the frame pointer ($s8 register, but referenced as $fp in the screenshot above). From the stack section, the value of 0x418920 will be loaded into the $gp (global pointer) register.
- Let’s step through the next instruction. In pwndbg, type in:
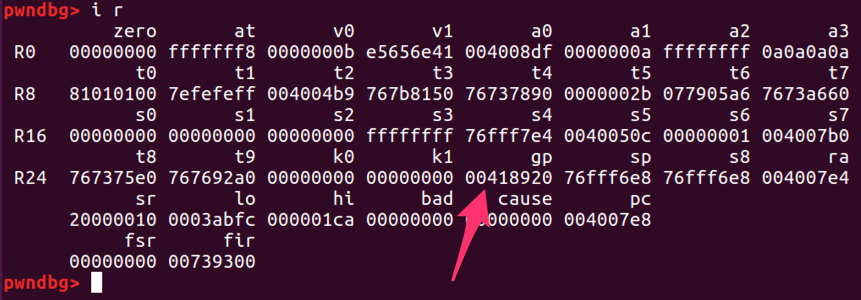
n - The register section above does not include the global pointer ($gp) register. Let’s check it out. In pwndbg, type in:
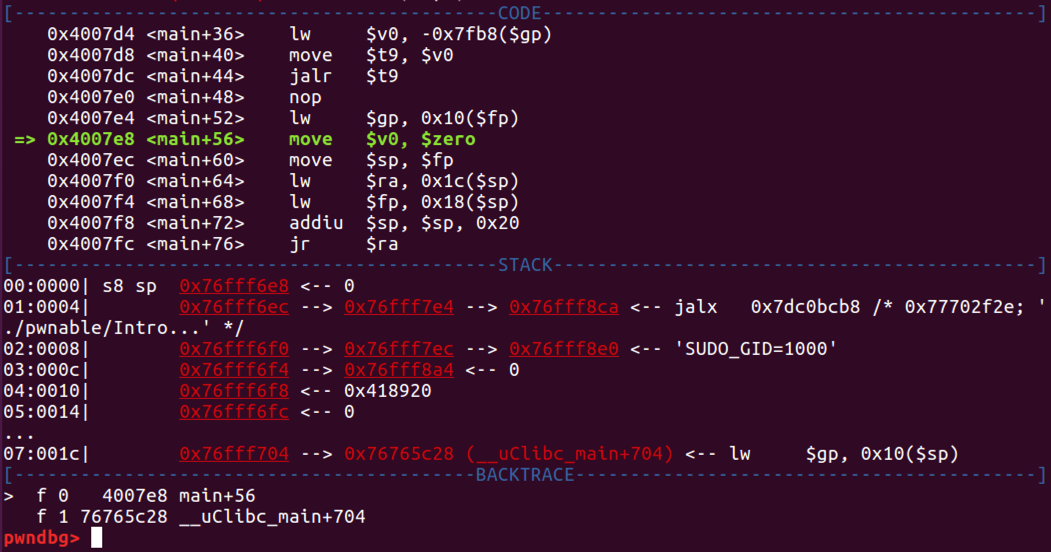
i r - We can see the program restored the $gp register back to the original value that was saved on the stack. The next instruction will move 0 into the $v0 register. Currently, the $v0 register has the value of “0xb”. Let’s step through the next instruction. In pwndbg, type in:
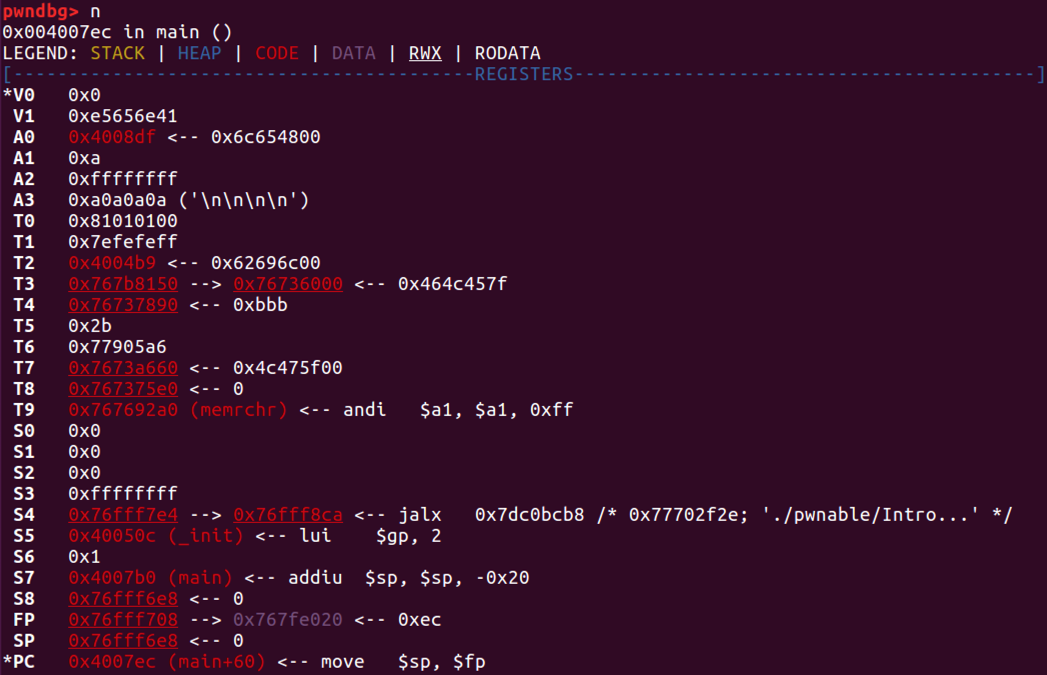
n - If we look at the $v0 register, we notice there is a “*” by it and the register holds the value of 0
- The next instruction moves the $fp register value to the $sp register value to restore the original stack pointer location. We observe that both $s8 and $sp have the same memory location and value.
- It would appear that this next instruction won’t do much from what we can see. In pwndbg, type in:
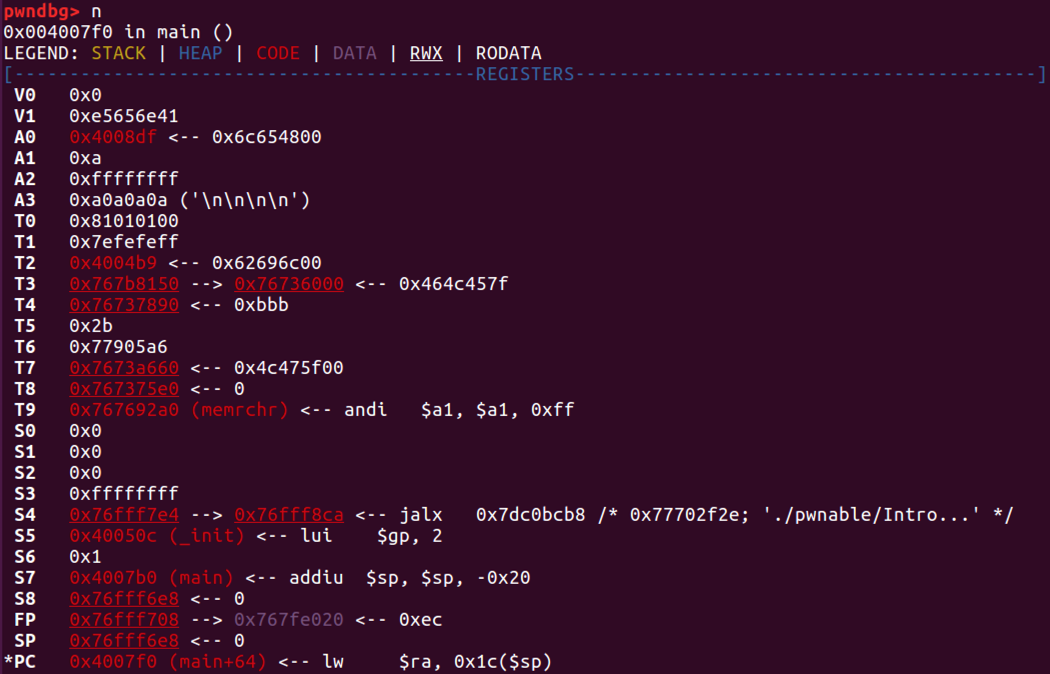
n - The next instruction will move the value at an offset of 0x1c from the $sp register into the $ra register. Looking at the screenshot above, it looks like 0x76765c28 will move into the $ra register. Lucky for us, we can see that it looks like this address points to the address space within uClibc’s main function which would appear to also start the cleanup for that function once program control returns to that space. That’s kinda neat. Let’s look at the current value in $ra. In pwndbg type in:
i r - The $ra register will be overwritten with 0x76765c28. The current value in $ra is the location of "lw" after the jump to printf.
- In pwndbg, type in:
n - Let’s take a look at the $ra register. In pwndbg, type in:
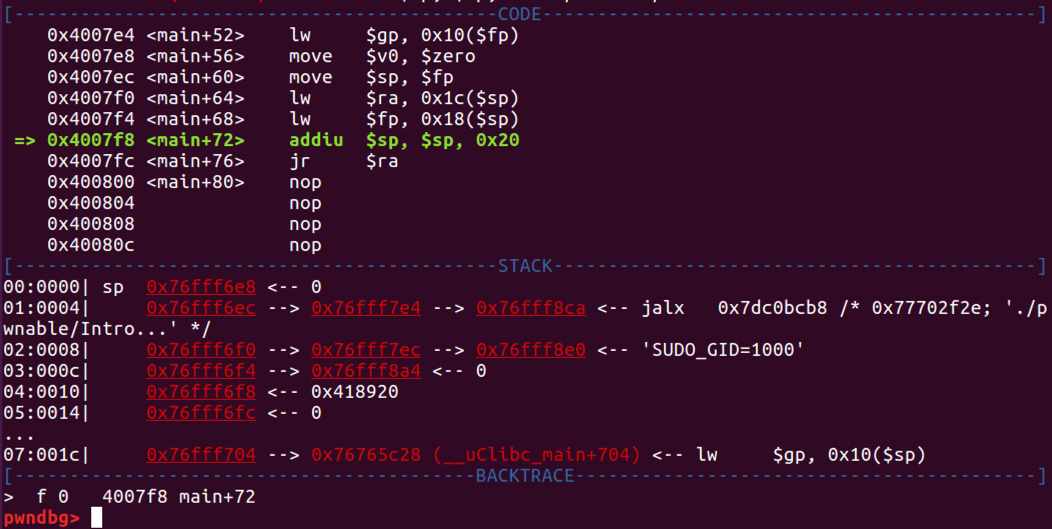
i r - The next instruction will move 0x18 from the $sp register into the $fp register (which will affect the $s8 register). The 0x18 line in the stack section has three dots which would be between 14 and 1c. This probably just means that the $s8 register will remain at 0.
- In pwndbg, type in:
n - Some interesting things happened in that last action. Working from the bottom, we can see that we no longer have the backtrace from uClibc in the backtrace section. In the registers section, we can see the $fp register with the value of 0x20 (weird) and the $s8 register has 0.
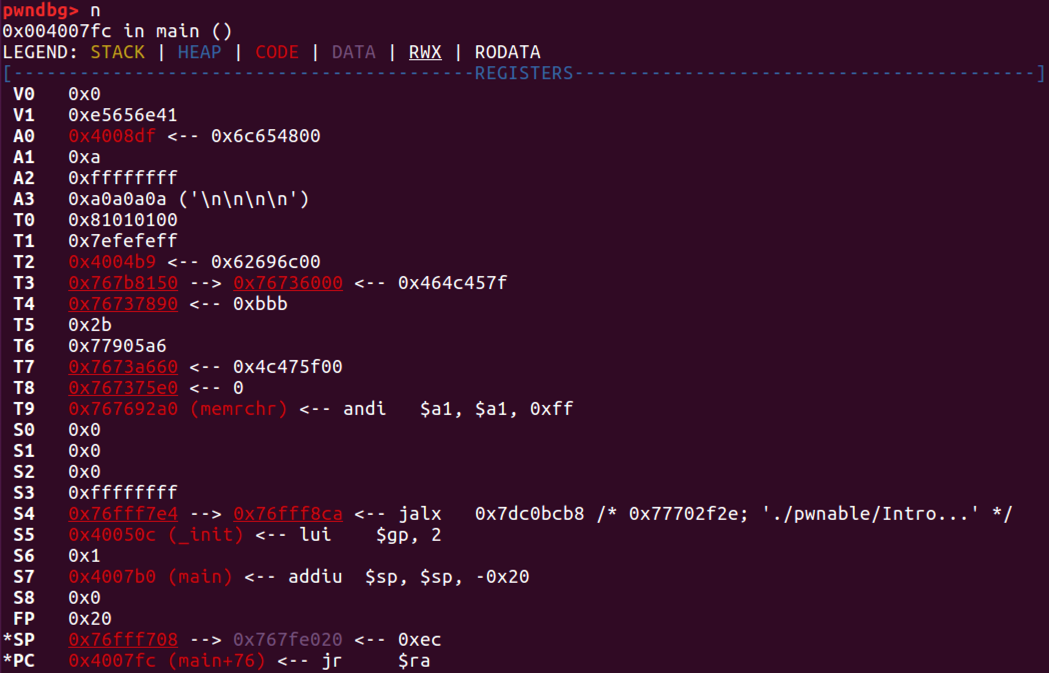
- The next instruction will reclaim the carving of 0x20 into the stack and bring the $sp pointer back to the original memory location. The stack grows toward zero and the original 0x20 carving was a negative value to have a lower memory address. In this upcoming instruction, the program will go 0x20 positive to make the reclamation. In pwndbg, type in:
n - We can see that the $sp register is now 0x20 higher at 0x76fff708. The previous value was 0x76fff6e8.
- The next instruction will jump to the memory address in the $ra register. The $ra register was populated earlier in step 11. As MIPS accounts for a delay slot after a jump, we see the nop below the jump. The jump will take program execution to the uClibc main function epilogue where that main instance will begin its own cleanup sequence.
- In pwndbg, type in:
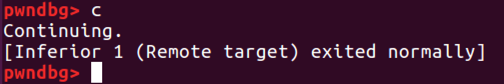
n - Clearly as we can see, we have entered The Matrix. Actually, no, we haven’t. But, we have continued the journey in uClibc.
- In pwndbg, type in:
c - We can see “Hello world” in the other Terminal window!
- In pwndbg, type in:
q


The next post will cover the stack overflow challenge and show how we can defeat it! Thanks for reading!
Subscribe to:
Posts (Atom)