Step 11 - “Hello” GDB demonstrated in 5 parts
In the previous post, we were able to get the appropriate “pre-checks” done for GDB/pwndbg. We trudged through the steps necessary to get GDB/pwndbg correctly aligned with steps to get a better debugging experience. This post will briefly examine the “hello” binary in GDB/pwndbg and then go through each line step-by-step in GDB/pwndbg. This is blog post 11, part 3 of 5, of post x in the learning with DVRF project series.
Part 3: Step-by-Step, line-by-line, here we go with the intro!
- In the first line of “main”, we see the highlighted line of “addiu” which will carve out space on the stack. Interestingly, in objdump, we saw the numerical value represented in decimal form as -32. Here in GDB/pwndbg, we see this represented as a hexadecimal value of -0x20.
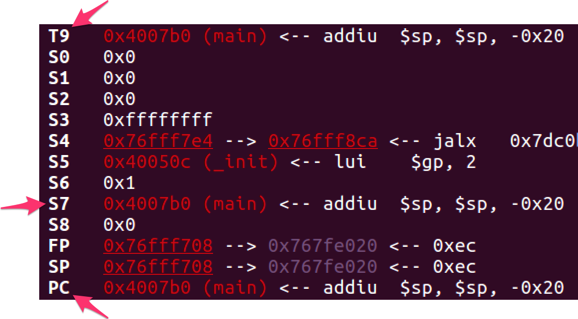
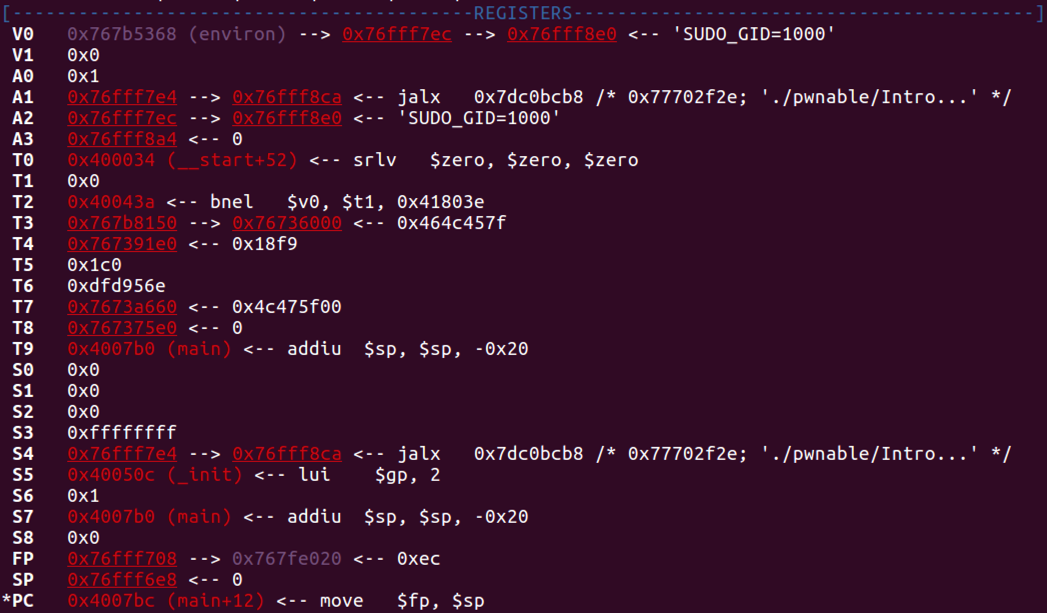
- If we look in the registers section, we see that $PC is also on the same line with the same instructions:
- Another interesting observation is that both $T9 and $S7 registers are set to the first memory address of main. The $T9 register is set from a previous function which would appear to be set from a jalr instruction as described in this article. The $S7 register would appear to be set from the previous function that called the main function and was changed as described in this article.
- Let’s step to the next line and see what happens next. Once we enter in “n”, we will see the stack grow as well as see each pane update. In pwndbg, type in:
n - Let’s do a before and after comparison of the stack.
4007b0 <main> view of the stack:
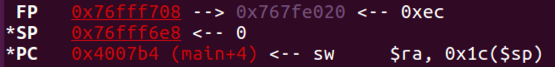
4007b4 <main+4> view of the stack: - We know the instruction in the <main> was to decrement the value of the memory address held in the $SP register by 0x20. The memory address before the line of instruction was 0x76fff708. The memory address after the line of instruction was 0x76fff6e8.
- This just proves that the instruction worked! We also see zero as the value being inserted at the 0x76fff6e8 address:
- Up in the registers section, we also see the same value reflected in the $SP register:
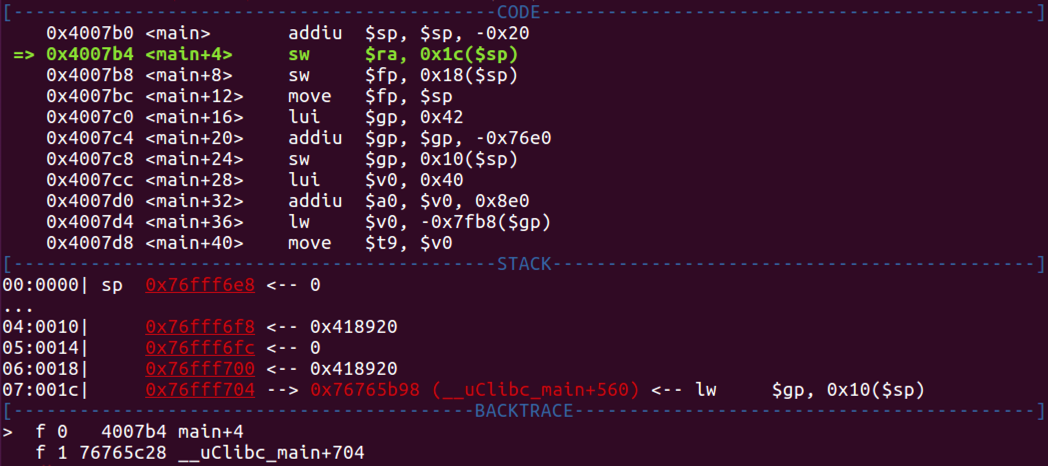
- The highlighted instruction (sw $ra,0x1c($sp)) in the code window tells us that we are going to store the value in the $ra register at an offset of 0x1c from the stack pointer. We do not however, see the $ra register in the “Registers” section. However, we can use the stock GDB option of viewing the registers.
- In pwndbg, type in:
i r - We can see the ra register has the address of the function to return to once the main function finishes. Here we can see the value in $ra is “0x76765c28”.
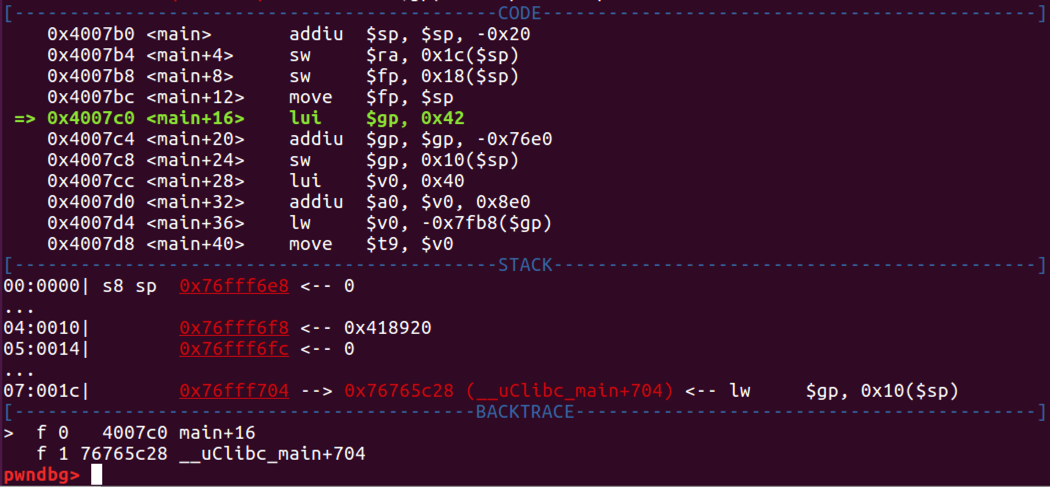
- Above the output of the “info registers” command, we should see the output from the context command. Right above, we should see the stack content as in the screenshot below. It would appear that at 0x1c (in our main function) from the stack pointer offset is a load word opcode that is loading whatever is located 0x10 from the stack pointer in the caller function into the $gp (global pointer) register.
- Let’s continue on with the execution of the program. In pwndbg, type in:
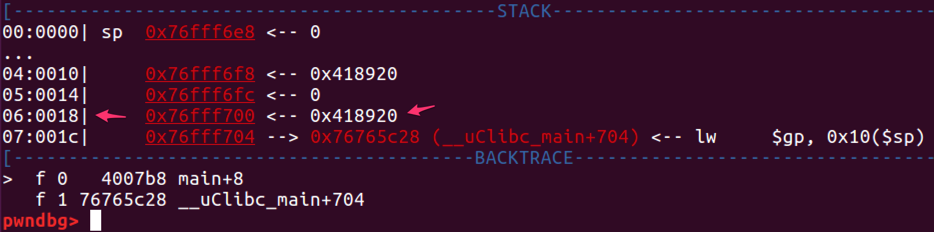
n - We can see now that the value in the $ra register (0x76765c28) is now in the offset of 0x1c from the stack pointer (which that offset is the memory address of 0x76fff704). Looking at the backtrace section, we see the same value that was in the $ra register that is saved on the stack is also the same address at “f 1”. This is like going back where we came from once main finishes and where the program execution flow would continue on from. If we were going to another function (e.g. a sub-function to calculate something), we would see an additional line in backtrace. We would see “f 2” with the address to return to in uClibc_main (at the offset of 704 bytes from the start of main). Then we would see “f 1” with the address of main and the appropriate offset from where in main the sub-function was called. Then in “f 0” we would see the memory address of the start of the sub-function and whatever offset we were at in the sub-function.
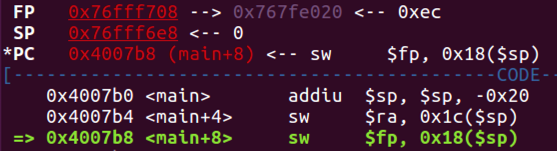
- In the next opcode, we see a similar instruction where the program will save the frame pointer onto the stack. However, this value will be stored at a memory address closer to the base memory address of the stack pointer register (0x18($sp)).
- From what we can see from the screenshot above, the value in memory address 0x76fff708 (which is labeled as the frame pointer register address) currently holds the value of 0x767fe020. The instruction highlighted in green suggests that it will store this value at the memory address located at an offset of 0x18 from the stack pointer register once this instruction is performed.
- We see in the stack the current values at an offset of 0x18. We know that once the next instruction is performed, this value at 0x18/0x76fff700 should change.
- In pwndbg, type in:
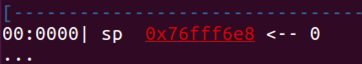
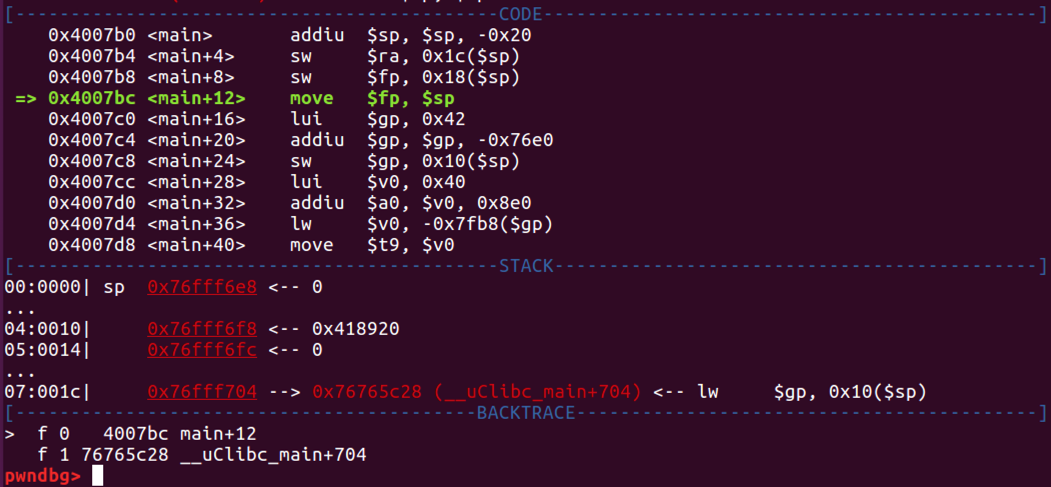
n - Interestingly, if we look at the “Stack” section, we do not see a memory address listed at 0x18 (which should be between 0014 and 001c). In fact, we see “...” instead of anything useful like the value of within the $fp register at this address.
- We can manually examine any memory address within GDB/pwndbg. We want to look at the memory address of an offset of 0x18 from the stack pointer. The memory address values on the stack are incrementing by 4 (in hex) from the stack pointer. If we subtract 4 (in hex) from 0x1c, we get 0x18. To calculate the memory address of the offset at 0x18, we can subtract 4 from the 0x1c offset which is memory address 0x76fff704. Subtracting 4 from 0x76fff704 leaves us with 0x76fff700. The memory address 0x76fff700 is the memory address at an offset of 0x18 from the stack pointer memory address. In pwndbg, type in:
x/w 0x76fff700 - The preceding command we performed was the “examine” command that lets us look at the “word” value of what we want to look at. In our case, we wanted to examine the full memory address of the memory location we specified (0x76fff700). But, this only returned zeroes or a NOP in MIPS. Well, that’s confusing. This may be an unexpected bug with GDB or pwndbg. Let’s look at the registers again.
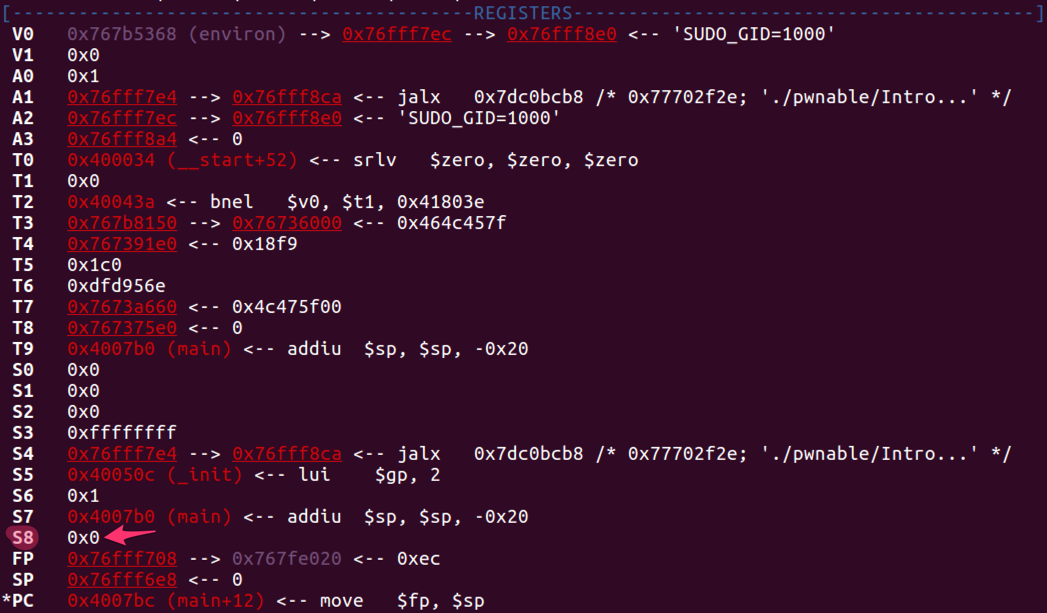
- Depending on the program interpreting a MIPS binary, the frame pointer can be referred to as $fp or $S8. In this case, it would appear that the frame pointer is actually being manipulated/changed/etc in S8.
- Based on this information, it would make sense that we saw “...” in the visual representation of the stack and 0x0 when we examined the memory address.
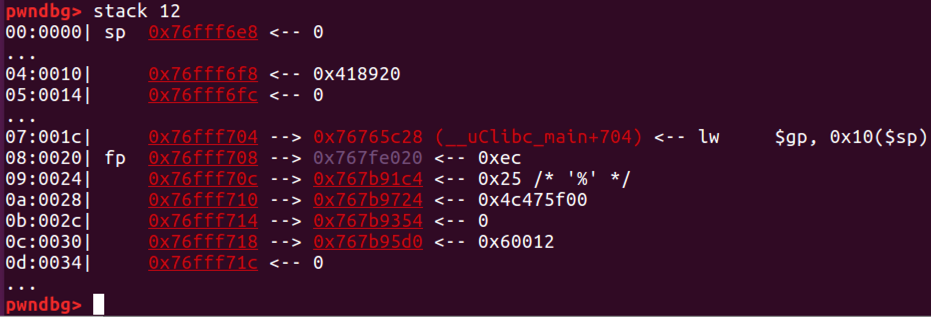
- While we are kinda talking about the stack, we can also see more of the stack than what we see in the “context” view. On the command line, we can specify, for example, 12 lines of the stack rather than the usual 4 or 5 values. In pwndbg, type in:
stack 12 - Since we carved out 0x20 worth of space on the stack (executed in line 0x4007b0), we can see where the frame pointer starts. Fun to play with and check out. Neat.
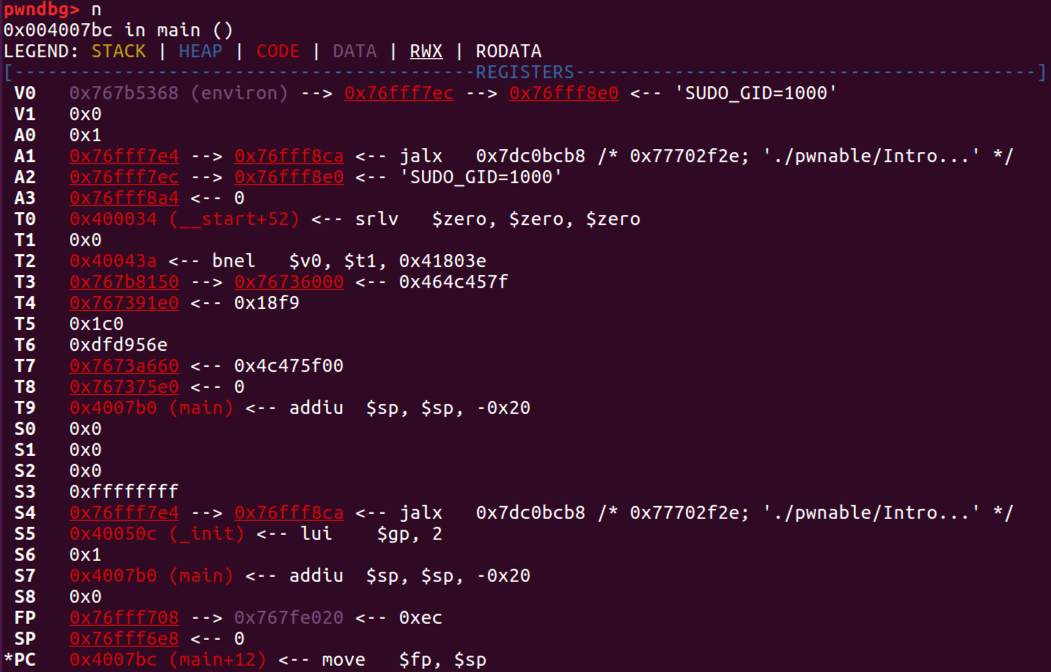
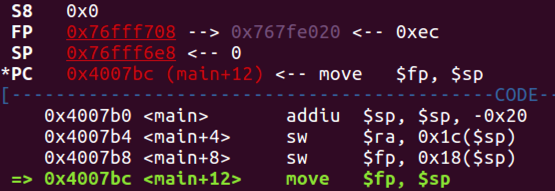
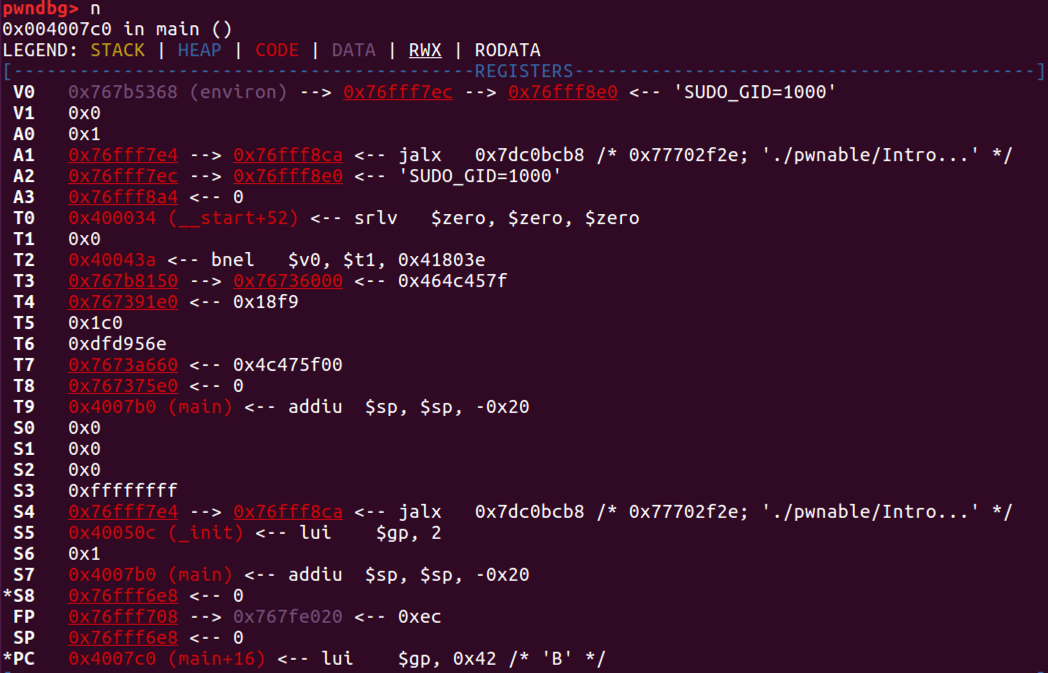
- The next instruction to be executed is “move $fp, $sp”. This command will move the value in the $sp (stack pointer) register into the $fp (frame pointer) register. This saves the memory location of the stack pointer into the frame pointer register. We can see the values in each register as below:
- Based on the instructions above, we should see 0x76fff6e8 in $SP also appear in $S8. Both of these values should hold a value of 0x0 once this instruction completes.
- Let’s step through the next instruction. In pwndbg, type in:
n - As expected, we can see the registers updated with the appropriate values:
- Another interesting observation: We can see a “*” next to the S8 register after the change. This looks to be an indicator to show what register was changed from the previous instruction.
- This post covered the prologue of the program to get us a better idea of the inner workings of how this process works. The next post will cover the meat of the program and step through getting “Hello world” printed to the screen.


No comments:
Post a Comment