Step 11 - “Hello” GDB demonstrated in 5 parts
In the previous post, we were able to get the appropriate “pre-checks” done for GDB/pwndbg. We trudged through the steps necessary to get GDB/pwndbg correctly aligned with steps to get a better debugging experience. This post will briefly examine the “hello” binary in GDB/pwndbg and then go through each line step-by-step in GDB/pwndbg. This is blog post 11, part 4 of 5, of post x in the learning with DVRF project series.
Part 4: The heart of the problem!
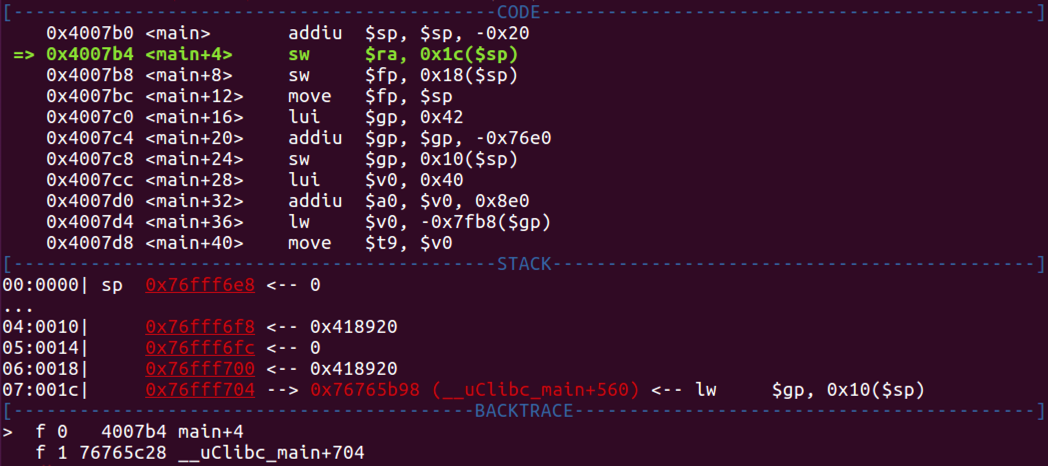
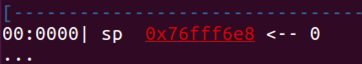
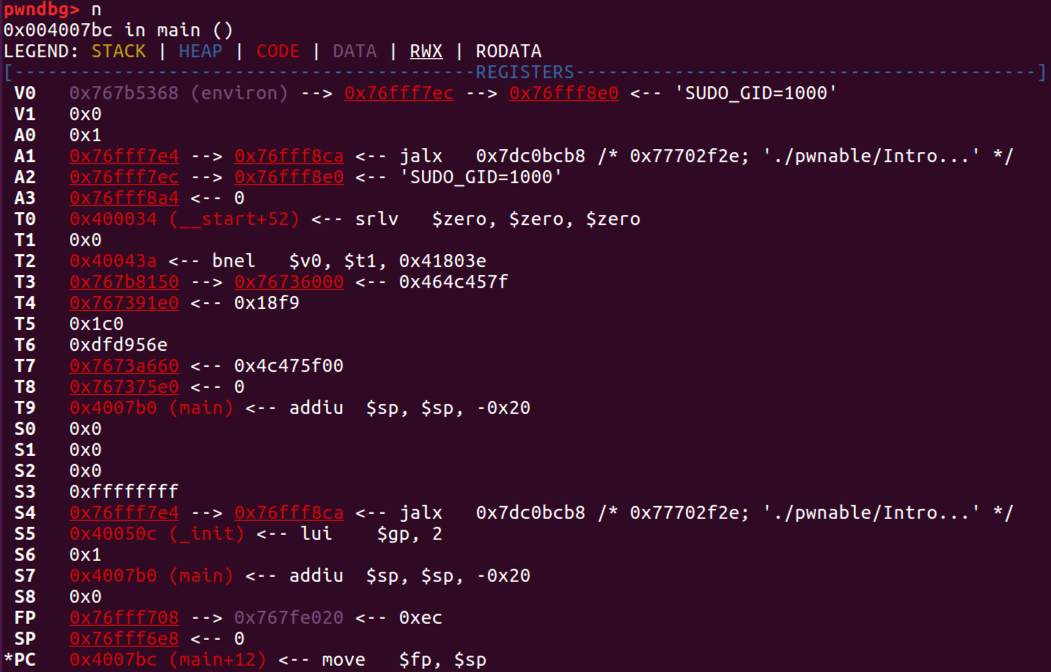
- Let’s get a refresher of where we are. In pwndbg, type in:
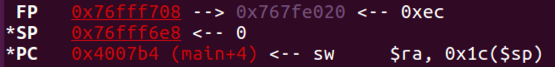
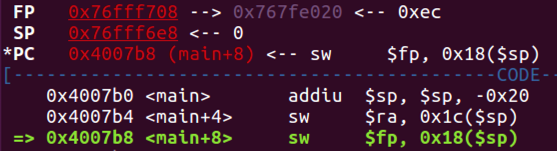
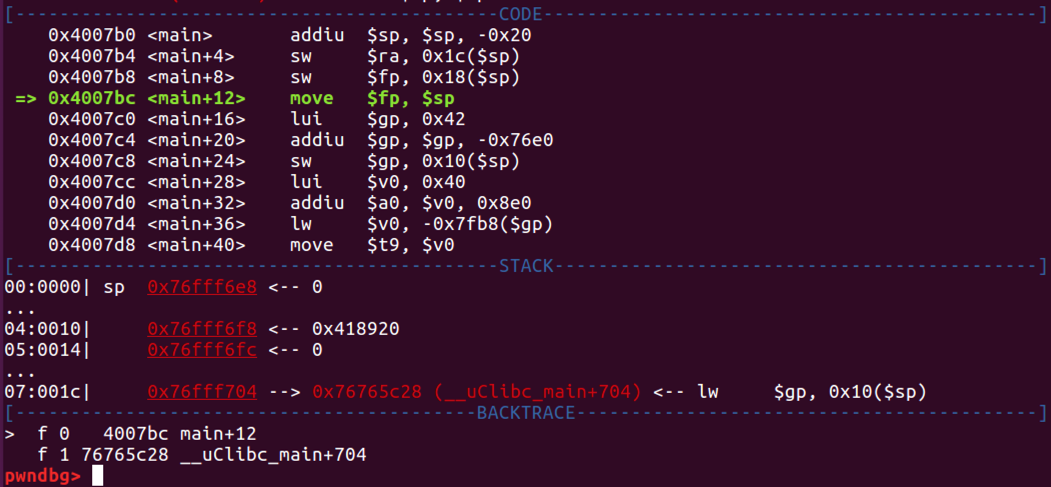
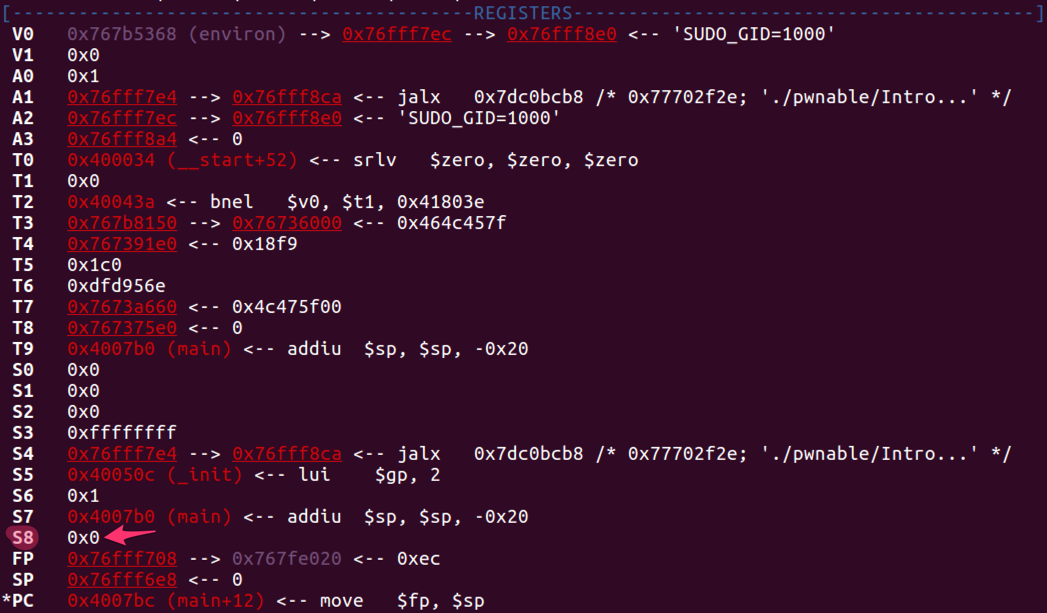
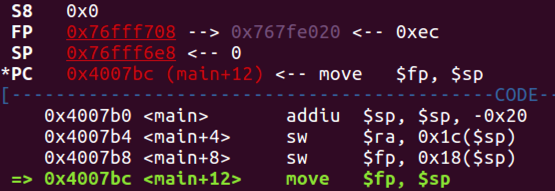
context - We can see in the previous screenshot that the next instruction to perform will be a “lui / load upper immediate” instruction. We’re going to take the upper part of a number (in our case the 0x0042 portion of the full 0x00420000) and put that into the $gp register. We also see that the $s8 register (which holds the frame pointer) has a “*” indicating it was altered in the previous instruction (where we saved the stack pointer).
- If we look in the registers section, we can see we do not have a holder for $gp. Let’s use the GDB method to see what's in the $gp register. In pwndbg, type in:
i r - Let’s step through the next instruction to place 0x0042 into the $gp register. In pwndbg, type in:
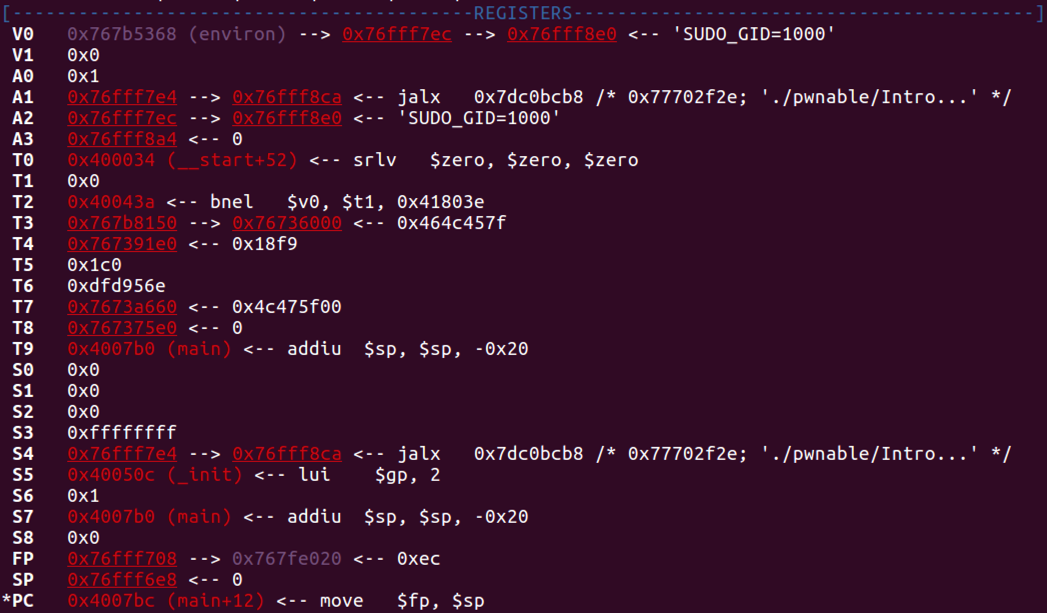
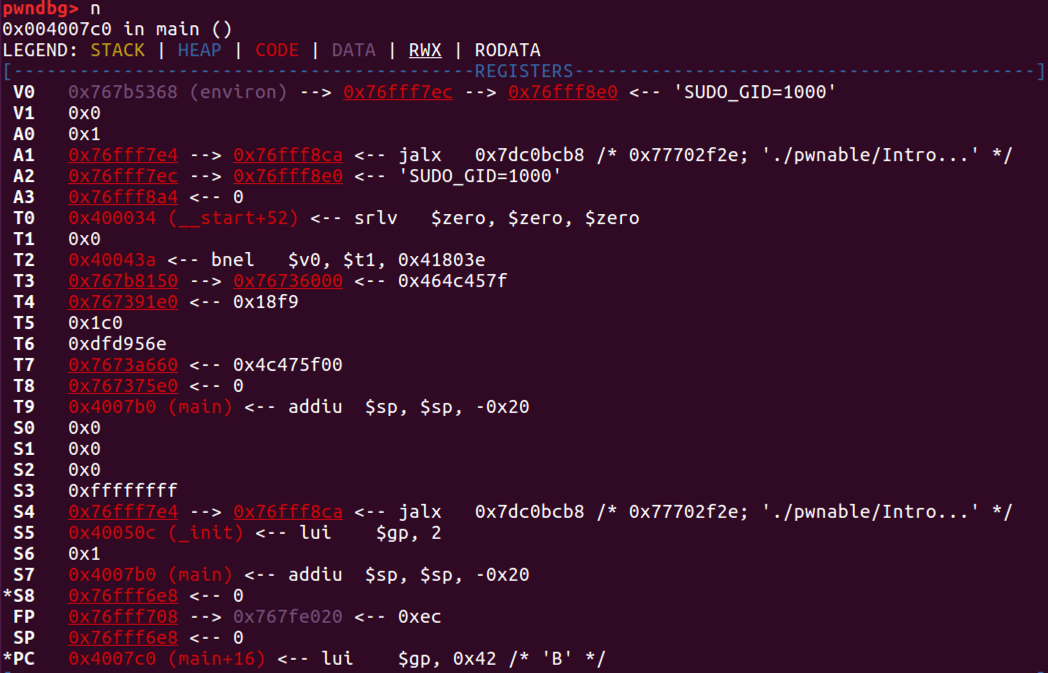
n - There does not appear to be any visible changes in the registers. Let’s check out the registers. In pwndbg, type in:
i r - We can see that 42 (well 0x0042) is in the upper half (left four digits) of the $gp register
- In the next instruction, we will subtract -76e0 from the value in the $gp register (0x00420000). The result will be stored in the $gp register.
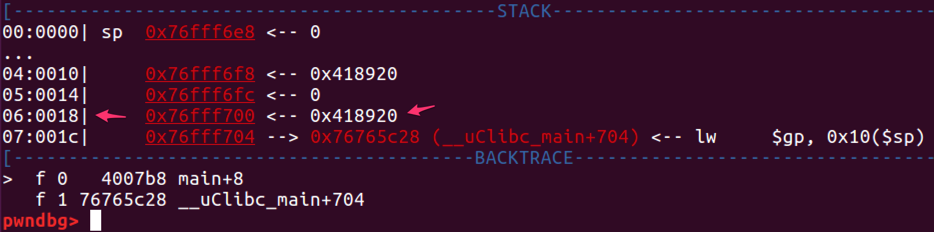
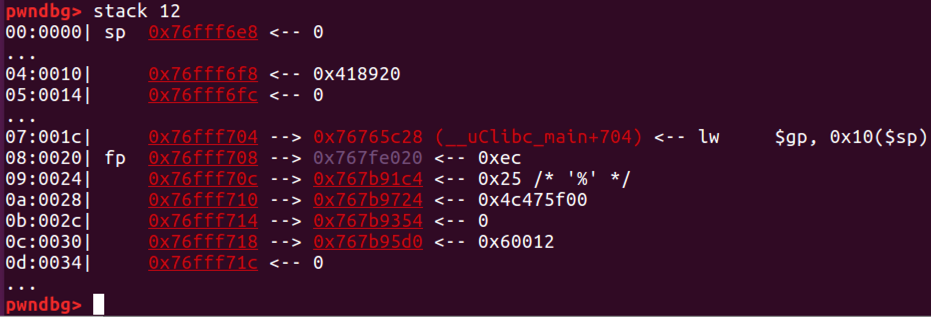
- Doing the math 0x042000 - 0x0076e0 equals 418920. We know from blog article #9 that this calculates the canonical gp value for the global offset table. We will need to know this value (418920) so we can calculate the offset for functions like printf. Let’s see this math affect the value to the $gp register in action. In pwndbg, type in:
n - Let’s check out the $gp register. In pwndbg, type in:
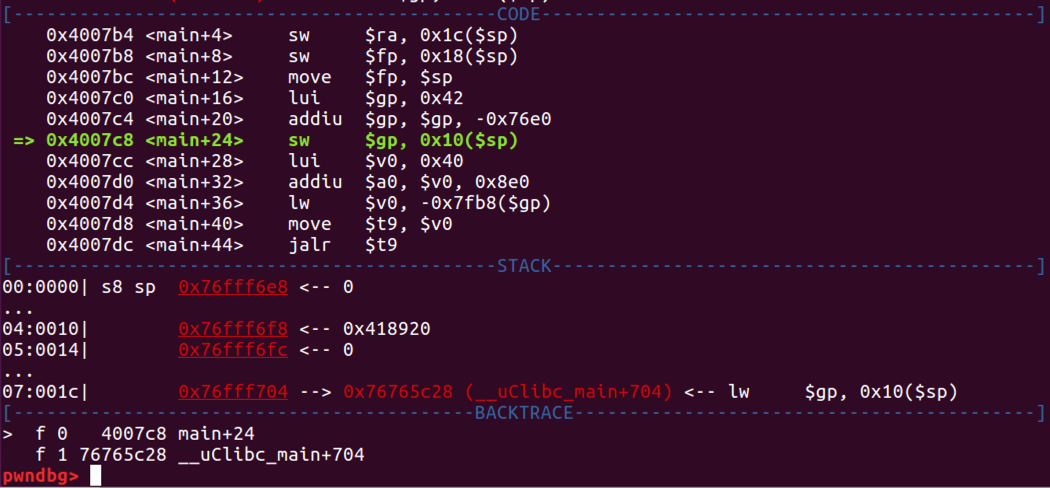
i r - Let’s get a fresh screen of what’s going on. In pwndbg, type in:
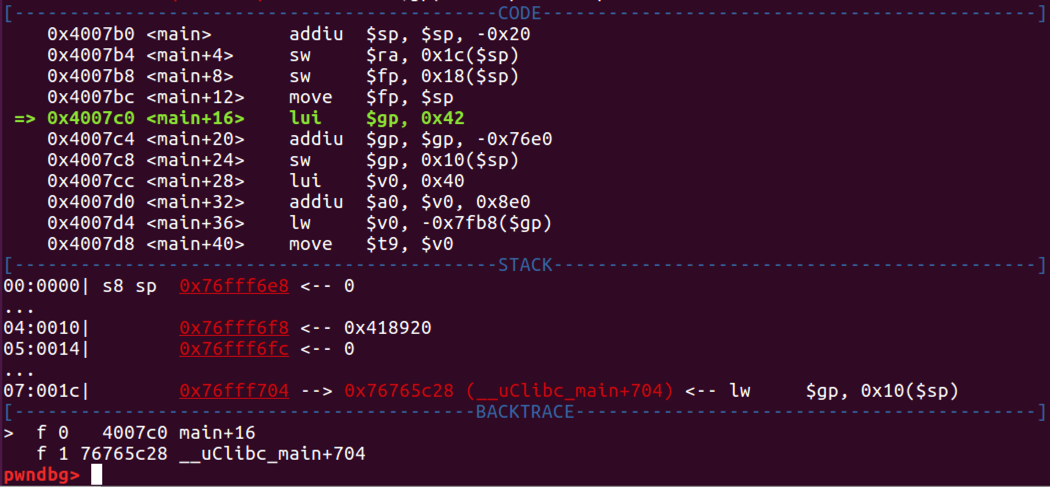
context - The next instruction we see highlighted as well in the $PC register is to store the contents of the $gp register onto the stack at an offset of 0x10 from the stack pointer. As we can already see in the stack section, 0x418920 is already on the stack at 0x10. Perhaps this was placed there already from GDB or some other mechanism? It should be interesting to see if the 0x10 stack offset changes when we step through the next instruction. In pwndbg, type in:
n - As we can see in the stack section, nothing appeared to have changed. The correct value is in there, but it was already in there.
- The next opcode is another “lui / load upper immediate” instruction. This time, we’re going to load 0x40 into the $v0 register. Currently in $v0, there’s nothing of value to us in there now.
- The $v0 register is typically used to store values from expression results or functions returning values. In this particular line, we’re going to do some number manipulation to set up future instructions. In pwndbg, type in:
n - We can see the $v0 register has a “*” next to it meaning it was changed in the last instruction. In the $v0 register we see that it has 0x400000 from the last instruction. The program shifted 0040 into the top half of the register.
- The next instruction is an “addiu” instruction where the program will add the middle and right values and store the value into the left register. In this case, the program will add the contents of the $v0 register (0x40000) with the immediate value of 0x8e0. The result of this addition will be stored in the $a0 register. Currently, the $a0 register has 0x1. This is should be the addition of 0x00400000 + 0x000008e0 which equals 0x004008e0. We can see this in action! In pwndbg, type in:
n - As we can see in the $a0 register, the value 0x4008e0 is in this register. Also, we can see that this is a memory address to the location in the .rodata section (discussed previously here) of the start of the “Hello world” string. In the register, we see that it automatically tries to resolve memory addresses to the representation of their value. In this case, this works out well for us as we can see this memory address holds “Hello world”. Additionally, we can see that the $a0 register has a “*” indicating it was altered from the last instruction.
- Previously we had seen values from the stack at an offset of the $sp register put into registers. In this case, we’re going have a “similar” concept where we’re going to pull an address from an offset of the $gp register. This process will resolve the location of the printf function that we identified with readelf. There are two ways (maybe more?) that we can resolve what this address (-0x7fb8($gp)) will be. The first way is to pull the address of $gp from the previous math operations that was eventually stored at 0x10($sp). Then we can do the math of subtracting 0x7fb8 to get the final address. That sounds exhausting.
- The second way is to use the examine command to help us out. This allows us to get creative with how we can figure out the memory address and what’s there. First things first, in pwndbg, type in:
x/xw $gp-0x7fb8 - The examine command (the first “x”) tells GDB to use the examine command. The “x” after the “/” tells GDB/pwndbg to give us the hexadecimal value. The “w” asks to give us the full word length of the address. We don’t necessarily need to specify “w”, but if you change the size of the values to be returned, this won’t change back to the default of “w” in some cases. It may help to specifically specify “w” to make sure we get all of the values back we care about… specifically.
- The address of 0x00400860 is the same address of printf that we identified in the previous blog article. But, we only know it’s printf from prior research. If we hadn’t done that and/or forgot, we wouldn’t have any idea what 0x00400860 meant. While we used the above command to get us the memory address, we can dereference the address to see what’s in there. To get that information, type in pwndbg:
x/xw *($gp-0x7fb8) - In the above screenshot are two changes from the previous command. We added parenthesis around the $gp and number. This just helped us to group the instructions together to make sure this subtraction expression was evaluated first. The more important change was to add “*” to the front of the parenthesis. If we did not add the “*”, we would get the same value of 0x400860 returned back. Adding in the “*” tells GDB to return back what’s in there rather than the address. In this case, we see it’s printf.
- From what we just learned, we can see that the program will put in the address of printf into the $v0 register. For functions to execute, first the arguments to functions are loaded into registers (or additionally onto the stack if there are not enough registers). Once the arguments are placed correctly (right to left), the function is “loaded” up. Once the function is correctly placed, the call to the function can be performed. In our case right now, the string of “Hello world” was placed into the $a0 register. This upcoming lw instruction, and the next instruction after that, setup printf to be placed correctly in the appropriate register to be executed with a jump. Once we step through the lw instruction, we should see 0x400860 placed into the $v0 register. In pwndbg, type in:
n - We can see the $v0 register has the 0x400860 value as well as tells us that the printf function is there.
- We didn’t necessarily need to do the examine work in a previous step, but it does help knowing what to expect and what the program is setting up for us. We may have figured out some kind of screen printing operation was going to happen with a string loaded into a register, but it helps to know how to figure it out. We also didn’t have automatic symbol resolution to tell us that printf was being resolved with those math operations.
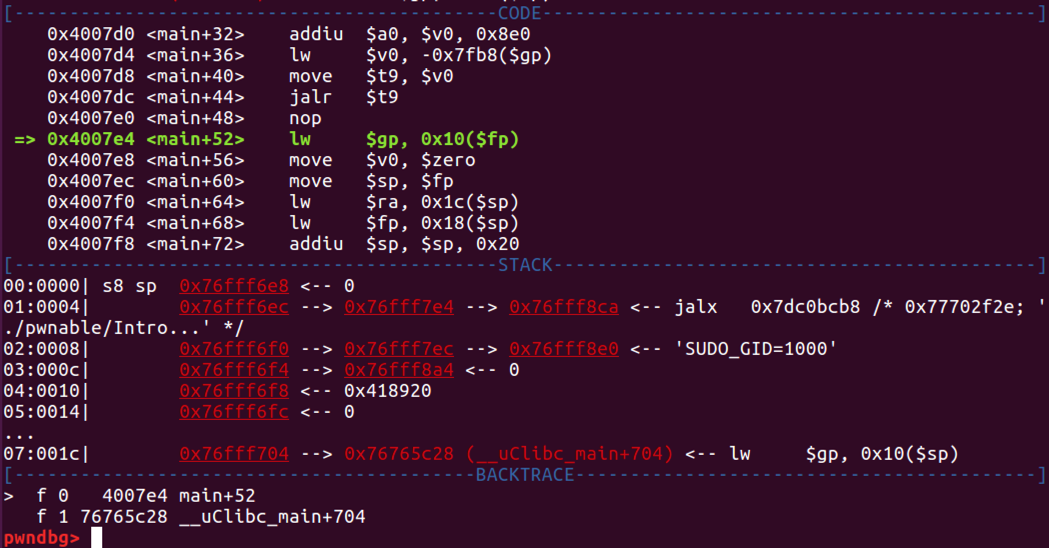
- The next instruction moves the contents from the $v0 register into the $t9 register. We will talk more about that after this instruction is executed. In pwndbg, type in:
n - We see the “*” by the $t9 register indicating that this register was altered. We see the same value in the $v0 register.
- Let’s talk about the $t9 register and why we had to move the value from $v0 to $t9. GDB needs to call another function with work to do and MIPS likes to have programs follow a specific way of performing function calls. The upcoming instruction is a jalr opcode. This instruction will jump to a specific address that is stored in a register and store the return address in another register ($ra). In this case, for a jalr instruction, the $t9 register needs to have the memory address that the jump function needs of the destination location to make the jump. The program will shift execution from within our main function and go to the printf function (located outside of main). We have previously set the arguments to printf and printf should operate with the parameters we set. In this case, we have provided printf with a string to print of “Hello world”.
- Let’s check out the $ra register to see what value is in there now. In pwndbg, type in:
i r - From what we know now, we should see the other Terminal window print out our string and see the $ra register change. In pwndbg, type in:
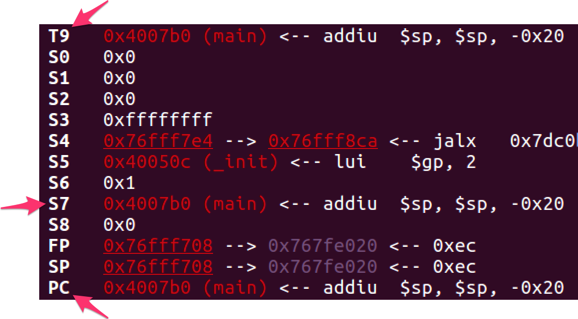
n - We did not see the “Hello world” string print out in the other Terminal window (but we will see it once execution finishes with our GDB/pwndbg session). This may be a result of emulation with Qemu and running the “hello” binary with a GDB debugger stub. Hard to say. However, we see a lot of registers with the “*” next to them after the printf function completed. Program execution also skipped over the “nop” opcode and went to the function epilogue. Let’s check out the other registers. In pwndbg, type in:
i r - We see the $ra register pointing to the memory address of the “lw” instruction set from the jalr instruction.
- This wraps up this post with the meat of the “main” completed. The rest of the instructions in the “main” function is cleanup and will be covered in the next post.