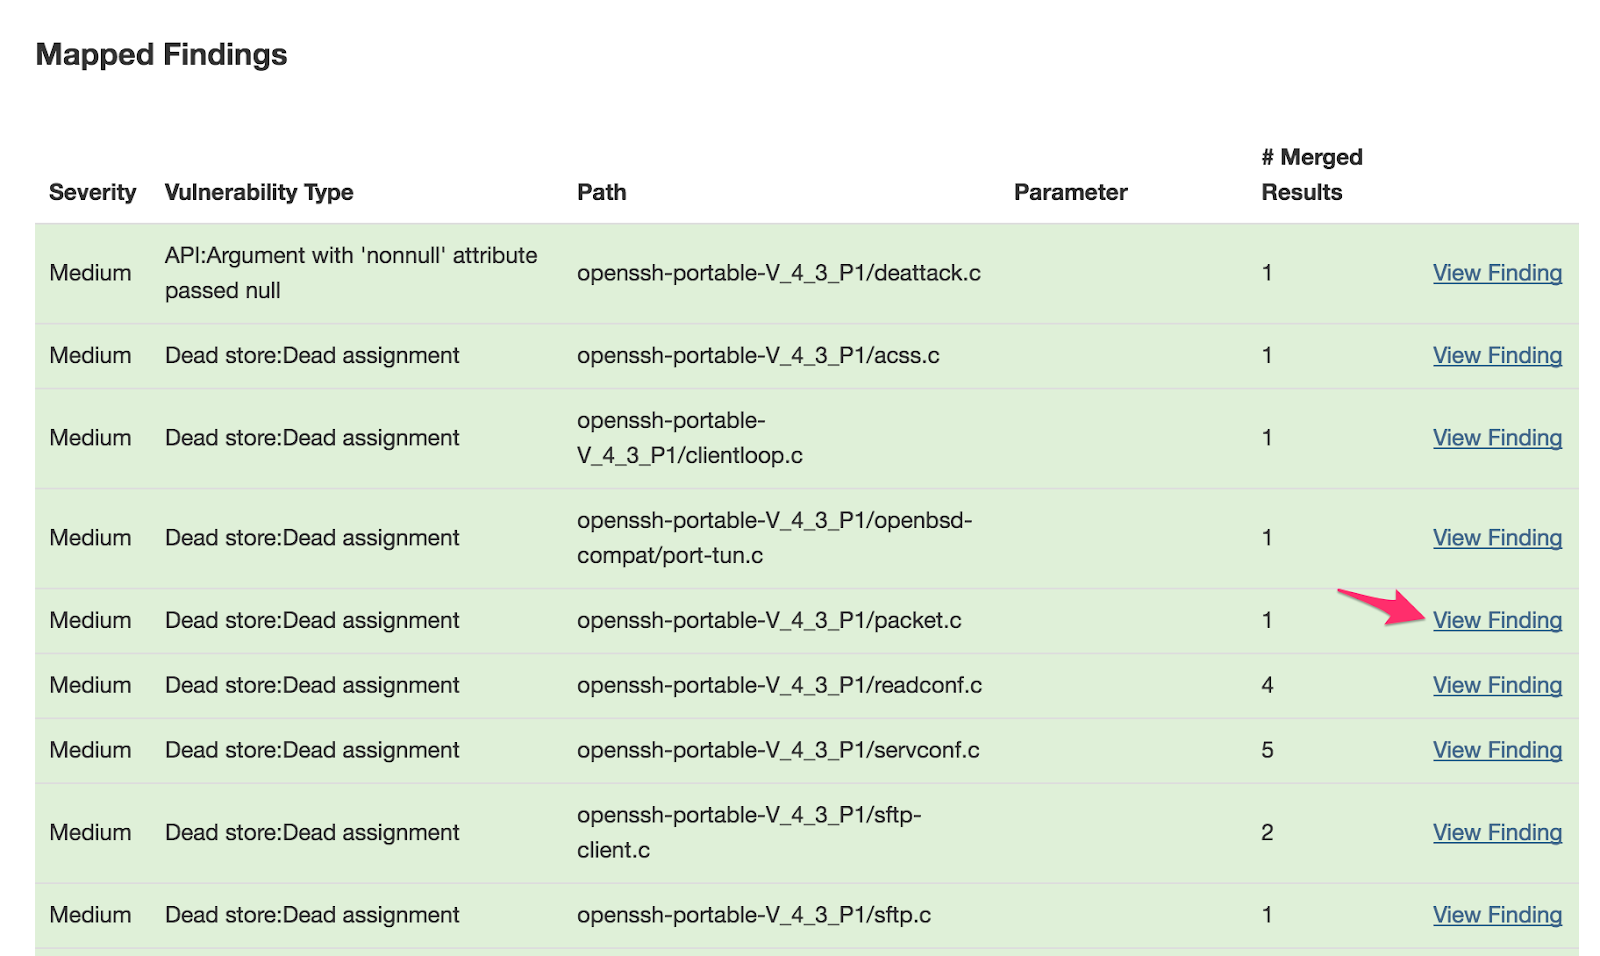
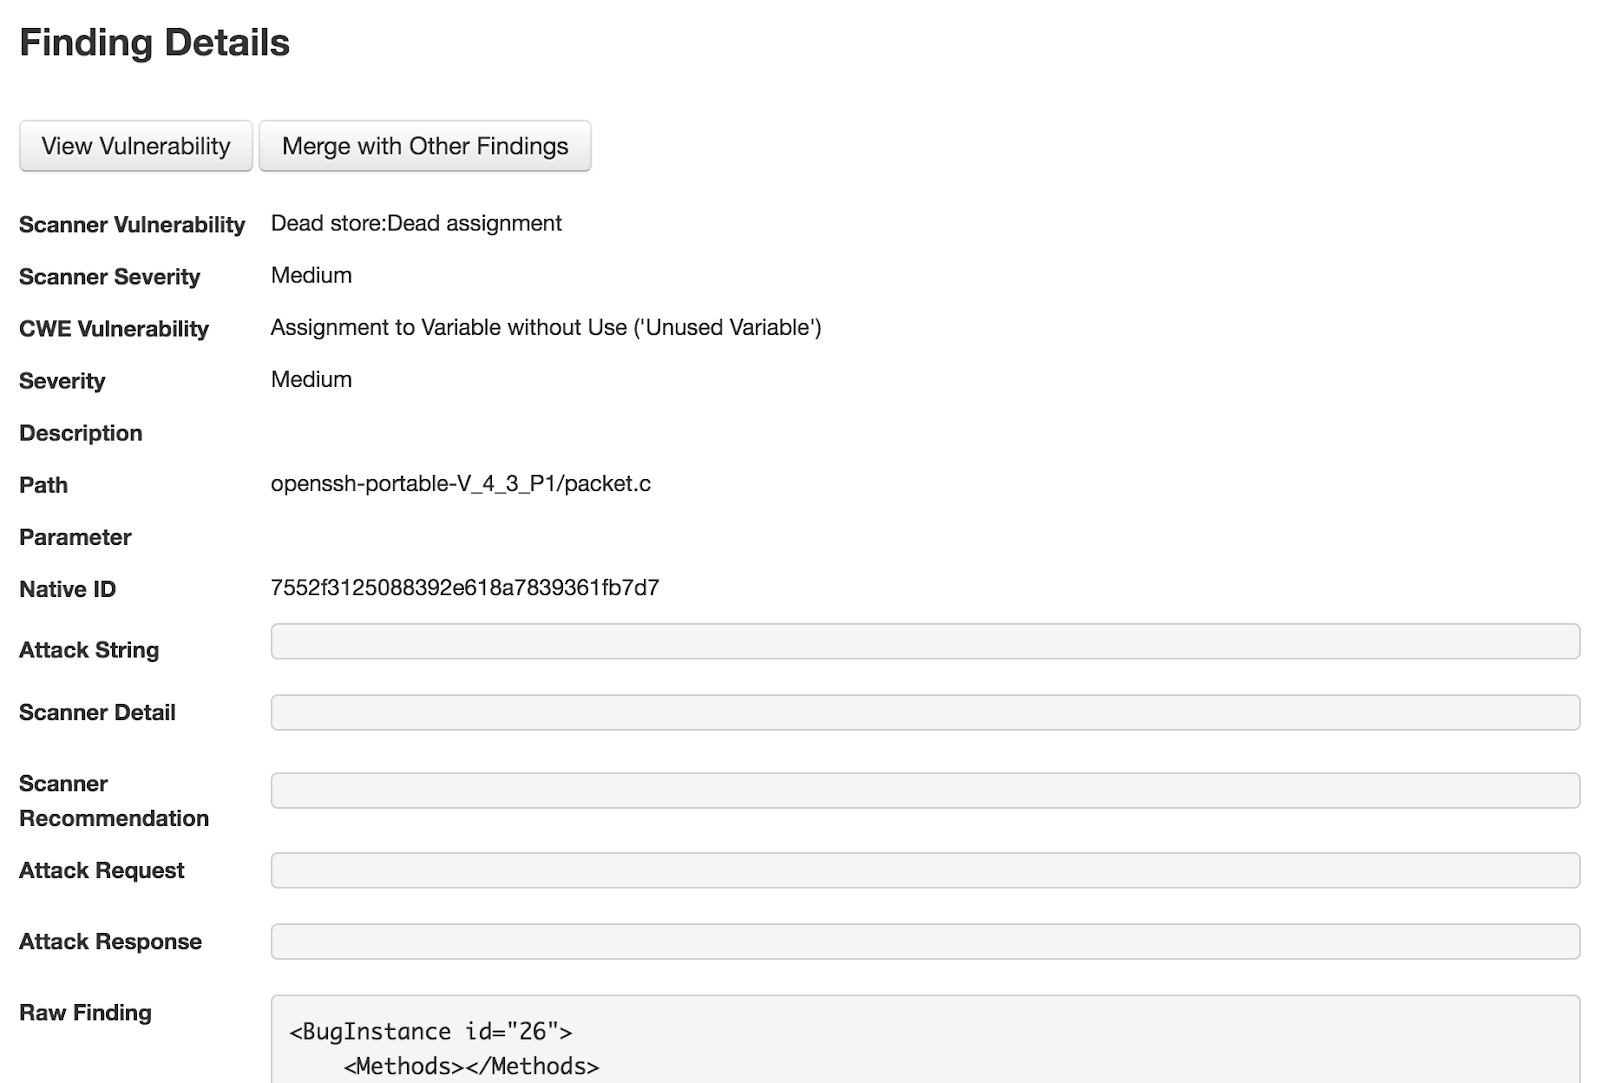
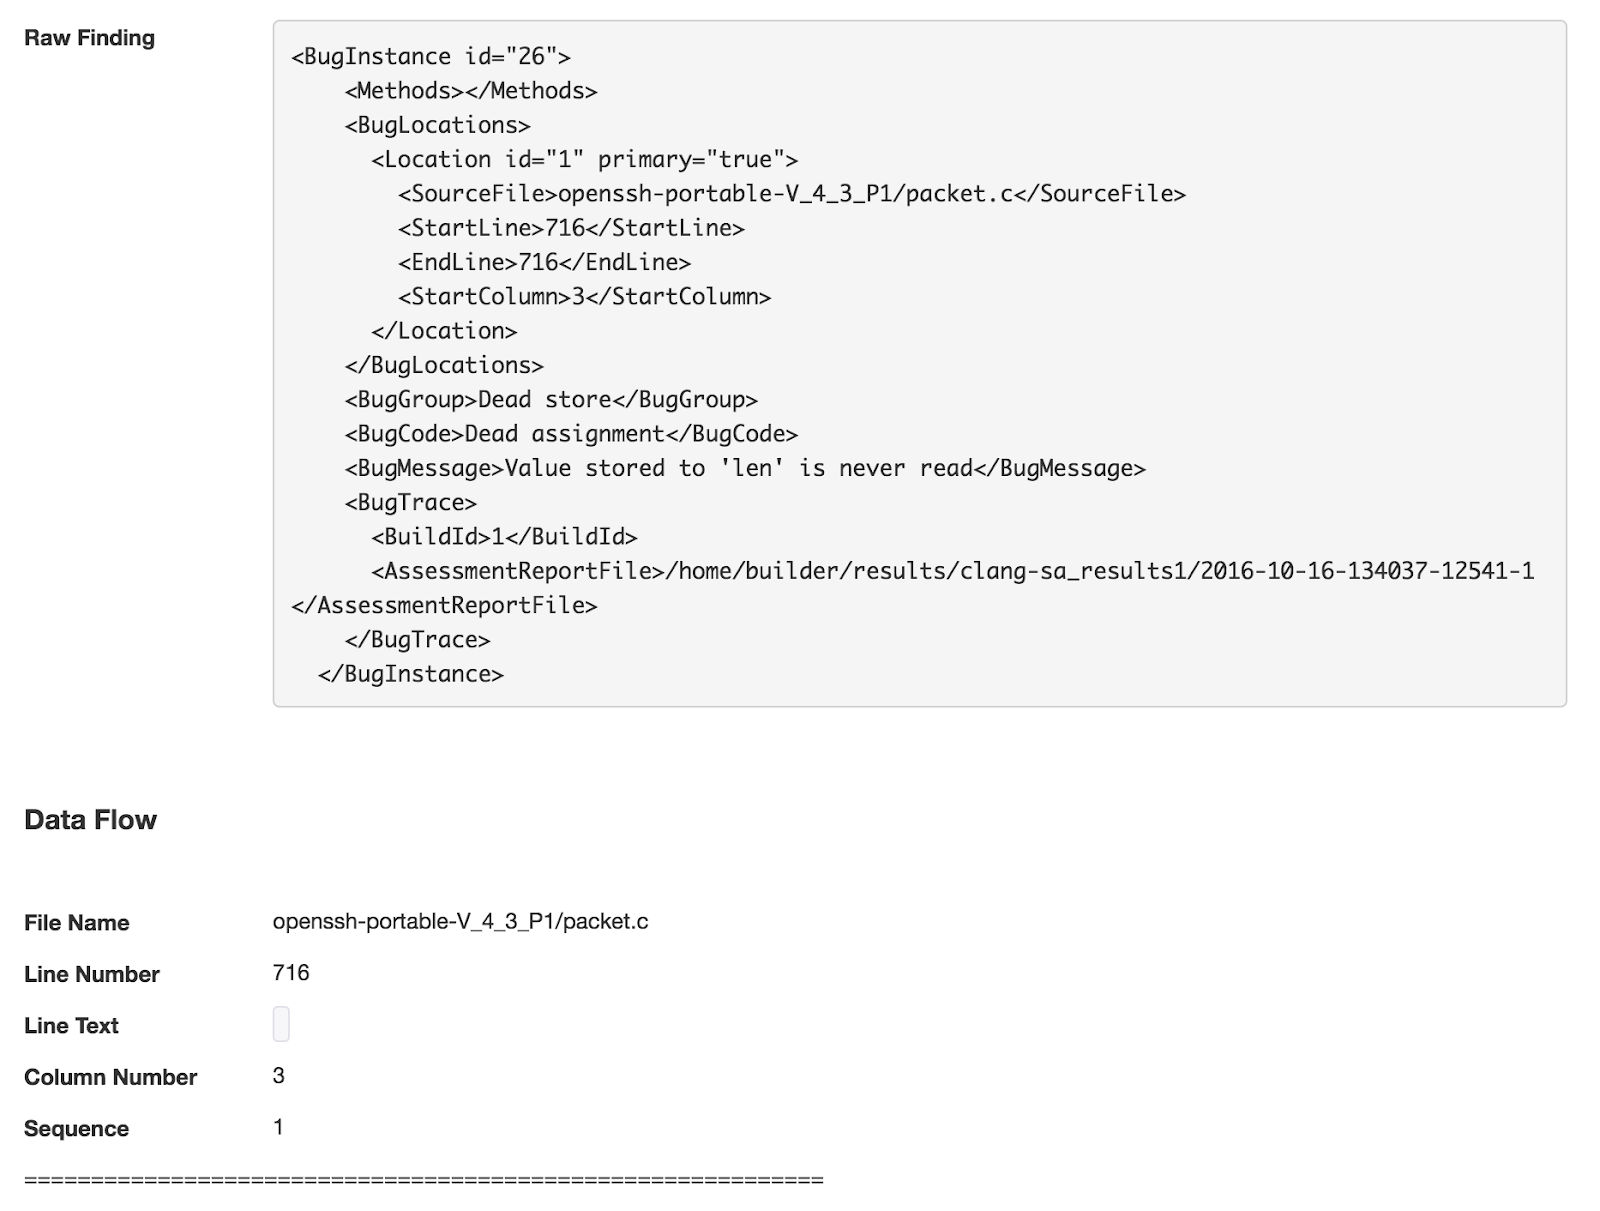
In the previous post, we performed the right steps for a successful assessment of OpenSSH 4.3 in the SWAMP. As we learned, those results were hard won! Now we have a lot of results!
Let’s take a deeper look at what we have available to us:
Log into the SWAMP
Click on “Results”
Click “any package”
Change the dropdown for the package to the appropriate version (in our case “OpenSSH 4.3 blog2”)
Now we can see results to this specific package with our successful results!

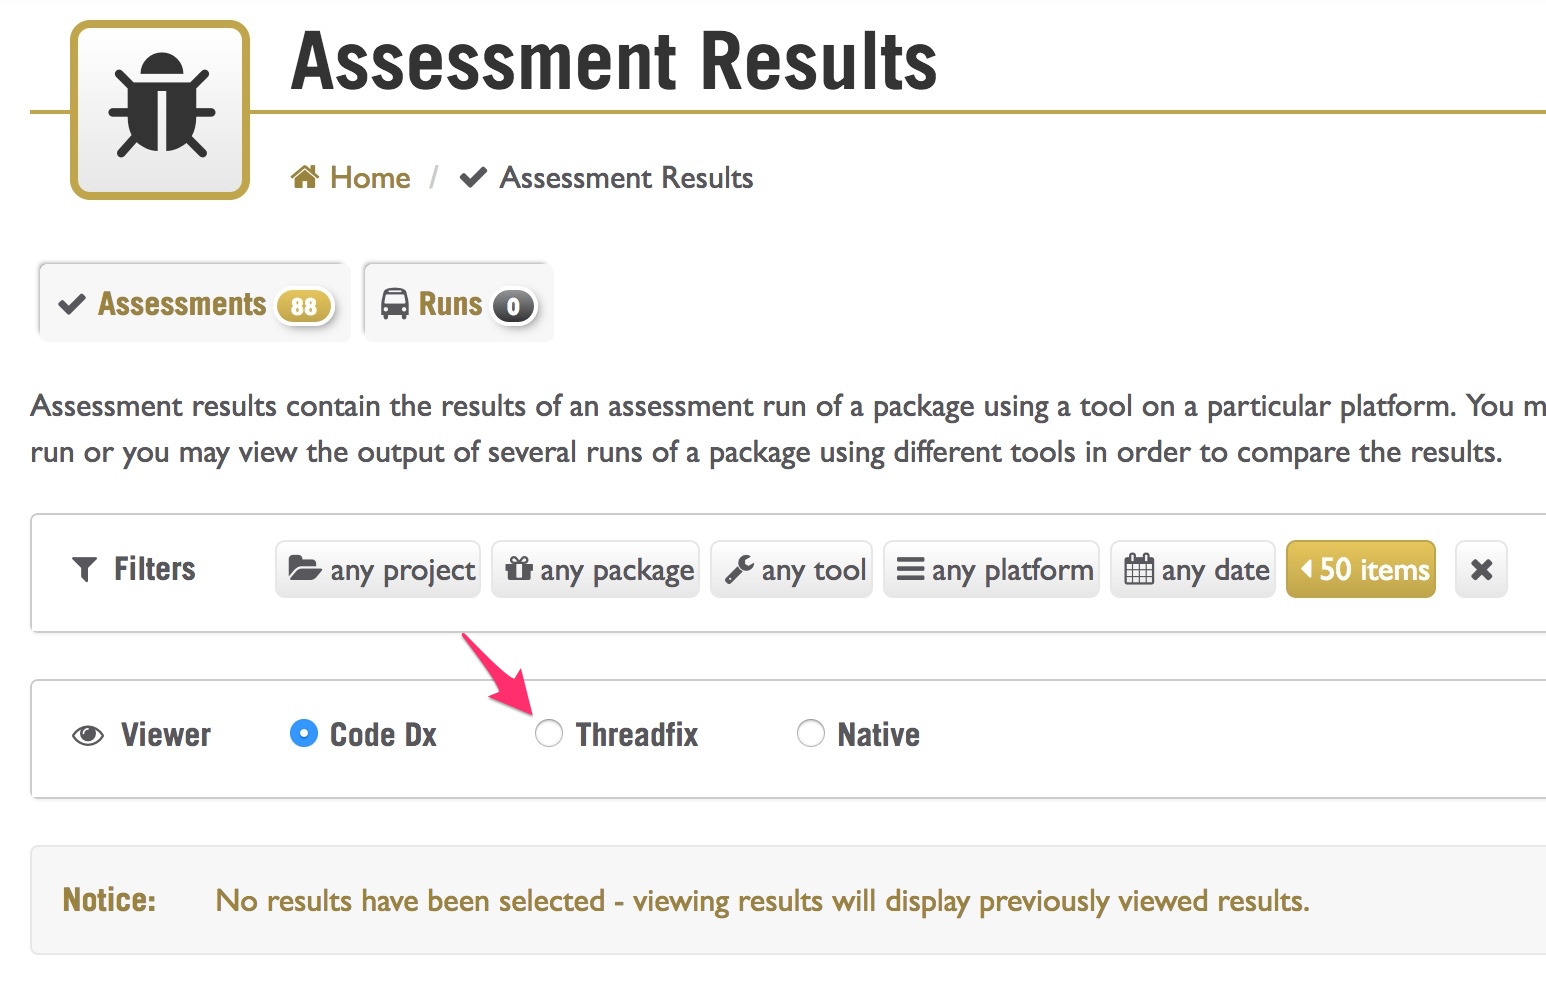
At the top, we see “Viewer” with three radio buttons of “Code Dx”, “Threadfix”, and “Native”. The default option is “Code Dx” which is one of two options to coalesce results from analysis tools into a single pane of glass. The second option is “Threadfix” which is another option to view results from multiple tools into a single pane of glass. The third option of “Native” displays the result of the tool from the standard output of the tool and may or may not be pretty.
To view the results of an assessment is a little bit confusing as there are a lot of things to click on. Let’s leave the default viewer of “Code Dx” selected.
Click on the checkbox for GCC (but there’s two!). Click on the right-most GCC checkbox.
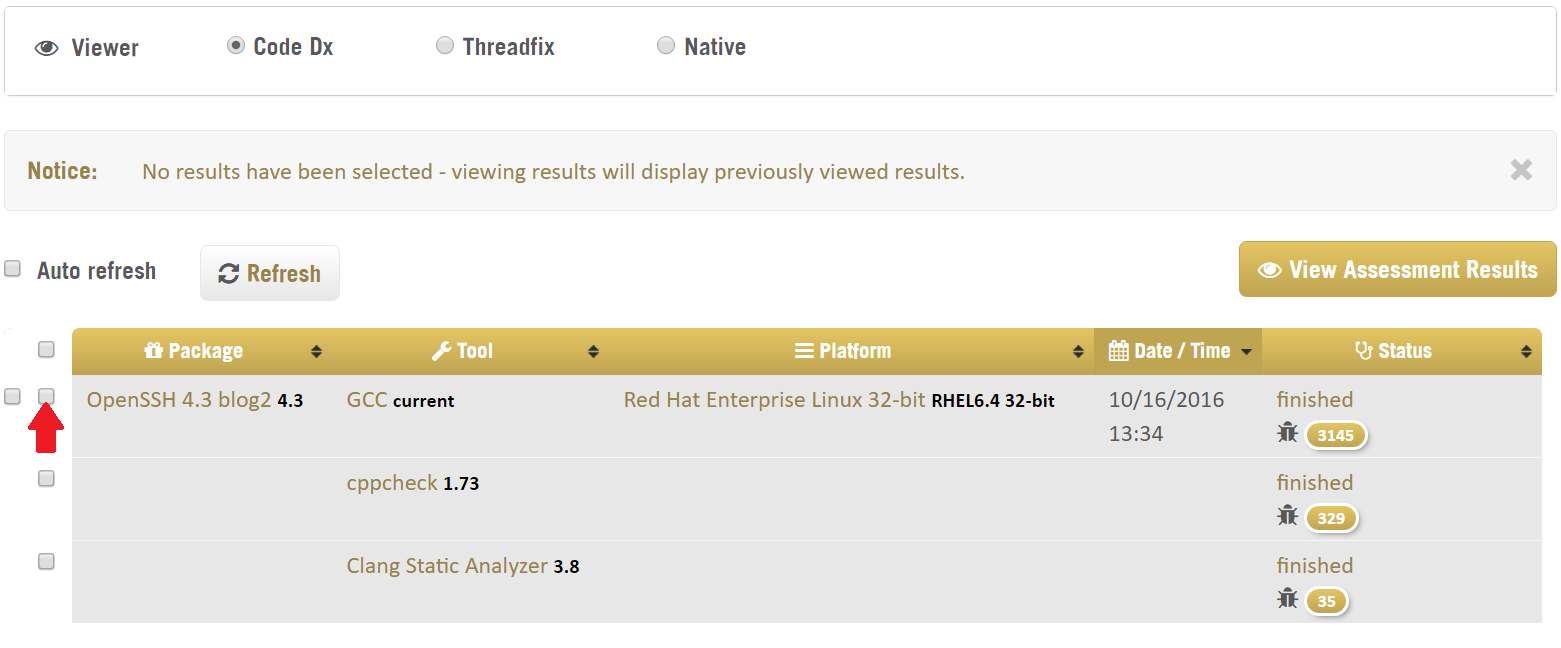
Navigating the checkboxes becomes easier to understand. For instance, in the screenshot above, we see 5 checkboxes. The topmost checkbox would select all results on the page to view. The leftmost checkbox would select all of the results from that particular run. The second, third, and fourth rightmost checkboxes would select the results from the individual tools.
We are going to see the results from GCC from this particular assessment.

You may be tempted to click on “finished” for the GCC line expecting to see the 3,145 bugs from GCC. However, these are not the droids you’re looking for. If you were to click on “finished”, you would get the details of the GCC assessment itself, not the results of the assessment. Below are the details of the GCC assessment:

If you clicked on “finished” click and see these results above, click on the “Ok” button at the bottom of the screen. Back in the main results screen, click the second, rightmost checkbox for GCC results as in step 10.
To see the results from the tool, we need to make sure we have the lines we wanted selected and click “View Assessment Results”
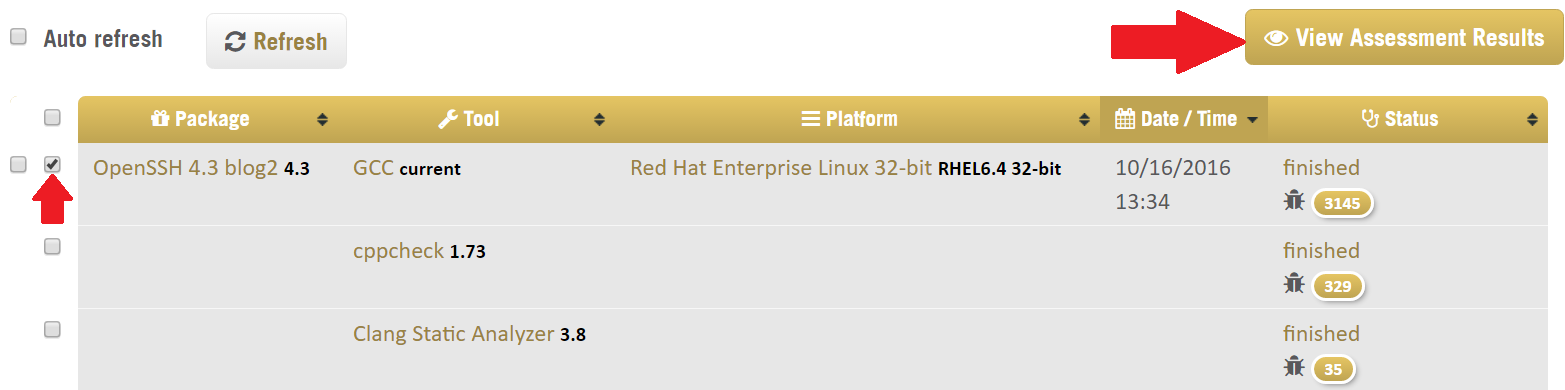
A new window will pop open and a viewer for our tool will be instantiated with our data.

Once the viewer for Code Dx is ready, you may see results from other packages or just this one depending on what you’ve done in the SWAMP. In our case, we see this:
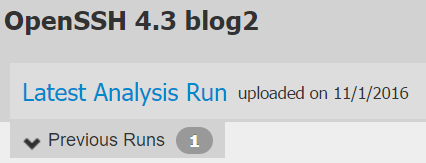
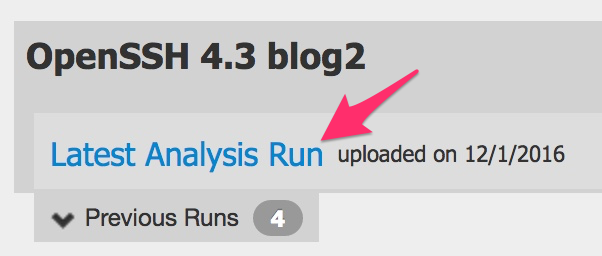
Click on “Latest Analysis Run” to see the results from this assessment
Here we can see all of the data that GCC found with OpenSSH 4.3

With Code Dx, we have a lot of different ways to play with this data and do so much. We can filter data on the left by severity, flaws, or any number of ways. If we filter the data by “Tool”, “Type Conversion”, and then “signed to unsigned conversion”, we can see the data filtered as below.
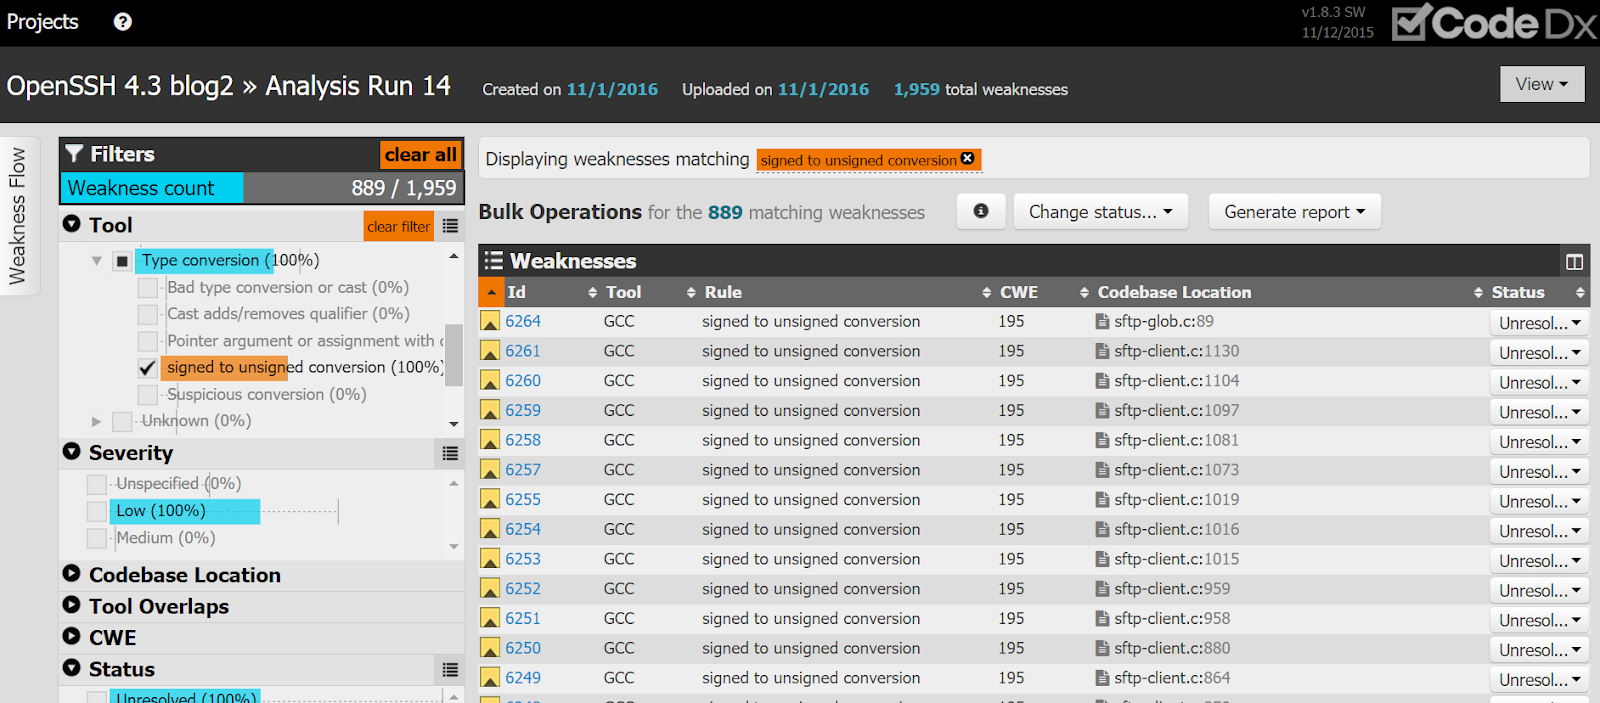
There’s a lot of things we can do further from here. We could filter the data to even more narrow results and then assign those issues to someone to fix with exact location. Let’s take a look at what kind of details we get.
Click on “6261”
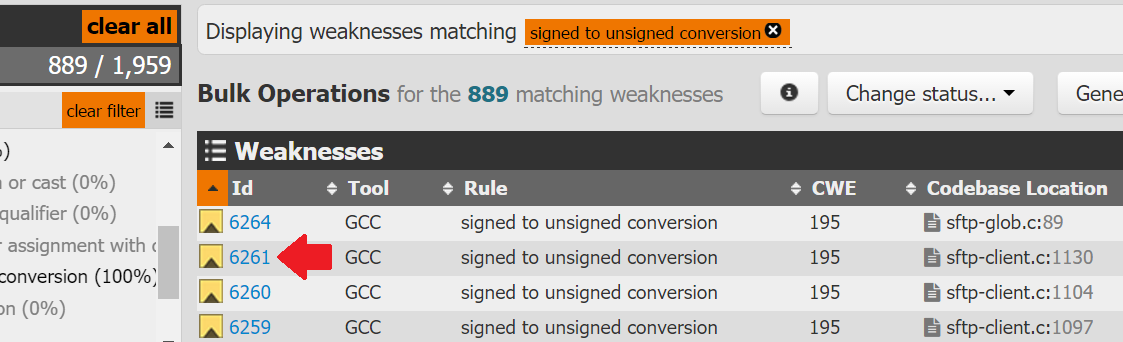
A new window will pop open with all of this juicy detail below:

Oh no, “goto” statements are used (line 1123). At least it’s not “goto fail”. But, we see things like the type conversion issue at line 1130, links to all kinds of sources, the ability to make notes, and more!
We briefly reviewed the results from the GCC tool within Code Dx. As we can see there is a lot of capability for teams to use the SWAMP to help secure their software! In the next post, we’ll go over Threadfix and continue to examine the results.